00000848392024FYfalsehttp://rollins.com/20241231#CustomerServicesMemberhttp://rollins.com/20241231#CustomerServicesMemberhttp://rollins.com/20241231#CustomerServicesMemberP3Y10050P1Y182172iso4217:USDxbrli:sharesiso4217:USDxbrli:sharesrol:segmentrol:reportingUnitrol:deliverablerol:storexbrli:purerol:businessrol:accountrol:hourrol:policyrol:offering00000848392024-01-012024-12-3100000848392024-06-3000000848392025-01-310000084839us-gaap:RevolvingCreditFacilityMember2024-12-310000084839us-gaap:RevolvingCreditFacilityMember2023-12-3100000848392024-12-3100000848392023-12-310000084839us-gaap:CustomerContractsMember2024-12-310000084839us-gaap:CustomerContractsMember2023-12-310000084839us-gaap:TrademarksAndTradeNamesMember2024-12-310000084839us-gaap:TrademarksAndTradeNamesMember2023-12-310000084839us-gaap:OtherIntangibleAssetsMember2024-12-310000084839us-gaap:OtherIntangibleAssetsMember2023-12-3100000848392022-01-012022-12-3100000848392023-01-012023-12-310000084839us-gaap:CommonStockMember2021-12-310000084839us-gaap:AdditionalPaidInCapitalMember2021-12-310000084839us-gaap:AccumulatedOtherComprehensiveIncomeMember2021-12-310000084839us-gaap:RetainedEarningsMember2021-12-3100000848392021-12-310000084839us-gaap:RetainedEarningsMember2022-01-012022-12-310000084839us-gaap:AccumulatedOtherComprehensiveIncomeMember2022-01-012022-12-310000084839us-gaap:CommonStockMember2022-01-012022-12-310000084839us-gaap:AdditionalPaidInCapitalMember2022-01-012022-12-310000084839us-gaap:CommonStockMember2022-12-310000084839us-gaap:AdditionalPaidInCapitalMember2022-12-310000084839us-gaap:AccumulatedOtherComprehensiveIncomeMember2022-12-310000084839us-gaap:RetainedEarningsMember2022-12-3100000848392022-12-310000084839us-gaap:RetainedEarningsMember2023-01-012023-12-310000084839us-gaap:AccumulatedOtherComprehensiveIncomeMember2023-01-012023-12-310000084839us-gaap:CommonStockMember2023-01-012023-12-310000084839us-gaap:AdditionalPaidInCapitalMember2023-01-012023-12-310000084839us-gaap:CommonStockMember2023-12-310000084839us-gaap:AdditionalPaidInCapitalMember2023-12-310000084839us-gaap:AccumulatedOtherComprehensiveIncomeMember2023-12-310000084839us-gaap:RetainedEarningsMember2023-12-310000084839us-gaap:RetainedEarningsMember2024-01-012024-12-310000084839us-gaap:AccumulatedOtherComprehensiveIncomeMember2024-01-012024-12-310000084839us-gaap:CommonStockMember2024-01-012024-12-310000084839us-gaap:AdditionalPaidInCapitalMember2024-01-012024-12-310000084839us-gaap:CommonStockMember2024-12-310000084839us-gaap:AdditionalPaidInCapitalMember2024-12-310000084839us-gaap:AccumulatedOtherComprehensiveIncomeMember2024-12-310000084839us-gaap:RetainedEarningsMember2024-12-310000084839country:US2024-12-310000084839us-gaap:NonUsMember2024-12-310000084839us-gaap:NonUsMember2023-12-310000084839srt:MinimumMemberus-gaap:BuildingMember2024-12-310000084839srt:MaximumMemberus-gaap:BuildingMember2024-12-310000084839srt:MinimumMemberus-gaap:FurnitureAndFixturesMember2024-12-310000084839srt:MinimumMemberus-gaap:EquipmentMember2024-12-310000084839srt:MaximumMemberus-gaap:EquipmentMember2024-12-310000084839srt:MaximumMemberus-gaap:FurnitureAndFixturesMember2024-12-310000084839srt:MinimumMemberus-gaap:SoftwareAndSoftwareDevelopmentCostsMember2024-12-310000084839srt:MaximumMemberus-gaap:SoftwareAndSoftwareDevelopmentCostsMember2024-12-310000084839rol:PerformanceShareUnitsMember2024-01-012024-12-310000084839us-gaap:FranchiseMember2024-01-012024-12-310000084839us-gaap:FranchiseMember2023-01-012023-12-310000084839us-gaap:FranchiseMember2022-01-012022-12-310000084839us-gaap:FranchiseMembersrt:MaximumMember2022-01-012022-12-310000084839us-gaap:FranchiseMembersrt:MaximumMember2024-01-012024-12-310000084839us-gaap:FranchiseMembersrt:MaximumMember2023-01-012023-12-310000084839rol:Acquisitions2024Member2024-12-310000084839rol:Acquisitions2024Memberus-gaap:CustomerContractsMember2024-12-310000084839rol:Acquisitions2024Memberus-gaap:TrademarksAndTradeNamesMember2024-12-310000084839rol:Acquisitions2024Memberus-gaap:OtherIntangibleAssetsMember2024-12-310000084839rol:Acquisitions2024Member2024-01-012024-12-310000084839rol:FPCHoldingsLLCMember2023-04-0100000848392023-04-030000084839rol:FPCHoldingsLLCMemberus-gaap:TrademarksAndTradeNamesMember2023-04-010000084839rol:FPCHoldingsLLCMember2023-04-012023-04-010000084839rol:FPCHoldingsLLCMember2024-01-012024-12-310000084839us-gaap:CustomerContractsMember2024-12-310000084839rol:Other2023AcquisitionsMember2023-12-310000084839rol:Other2023AcquisitionsMemberus-gaap:CustomerContractsMember2023-12-310000084839rol:Other2023AcquisitionsMemberus-gaap:TrademarksAndTradeNamesMember2023-12-310000084839rol:Other2023AcquisitionsMemberus-gaap:OtherIntangibleAssetsMember2023-12-310000084839country:US2024-01-012024-12-310000084839country:US2023-01-012023-12-310000084839country:US2022-01-012022-12-310000084839us-gaap:NonUsMember2024-01-012024-12-310000084839us-gaap:NonUsMember2023-01-012023-12-310000084839us-gaap:NonUsMember2022-01-012022-12-310000084839rol:ResidentialRevenueMember2024-01-012024-12-310000084839rol:ResidentialRevenueMember2023-01-012023-12-310000084839rol:ResidentialRevenueMember2022-01-012022-12-310000084839rol:CommercialRevenueMember2024-01-012024-12-310000084839rol:CommercialRevenueMember2023-01-012023-12-310000084839rol:CommercialRevenueMember2022-01-012022-12-310000084839rol:TermiteCompletionsBaitMonitoringRenewalsAncillaryMember2024-01-012024-12-310000084839rol:TermiteCompletionsBaitMonitoringRenewalsAncillaryMember2023-01-012023-12-310000084839rol:TermiteCompletionsBaitMonitoringRenewalsAncillaryMember2022-01-012022-12-310000084839rol:OtherRevenuesMember2024-01-012024-12-310000084839rol:OtherRevenuesMember2023-01-012023-12-310000084839rol:OtherRevenuesMember2022-01-012022-12-310000084839us-gaap:OtherCurrentAssetsMember2024-12-310000084839us-gaap:OtherAssetsMember2024-12-310000084839us-gaap:OtherCurrentAssetsMember2023-12-310000084839us-gaap:OtherAssetsMember2023-12-310000084839us-gaap:TradeAccountsReceivableMember2021-12-310000084839us-gaap:FinanceReceivablesMember2021-12-310000084839us-gaap:TradeAccountsReceivableMember2022-01-012022-12-310000084839us-gaap:FinanceReceivablesMember2022-01-012022-12-310000084839us-gaap:TradeAccountsReceivableMember2022-12-310000084839us-gaap:FinanceReceivablesMember2022-12-310000084839us-gaap:TradeAccountsReceivableMember2023-01-012023-12-310000084839us-gaap:FinanceReceivablesMember2023-01-012023-12-310000084839us-gaap:TradeAccountsReceivableMember2023-12-310000084839us-gaap:FinanceReceivablesMember2023-12-310000084839us-gaap:TradeAccountsReceivableMember2024-01-012024-12-310000084839us-gaap:FinanceReceivablesMember2024-01-012024-12-310000084839us-gaap:TradeAccountsReceivableMember2024-12-310000084839us-gaap:FinanceReceivablesMember2024-12-310000084839us-gaap:FinancingReceivables30To59DaysPastDueMember2024-12-310000084839us-gaap:FinancingReceivables30To59DaysPastDueMember2023-12-310000084839us-gaap:FinancingReceivables60To89DaysPastDueMember2024-12-310000084839us-gaap:FinancingReceivables60To89DaysPastDueMember2023-12-310000084839us-gaap:FinancingReceivablesEqualToGreaterThan90DaysPastDueMember2024-12-310000084839us-gaap:FinancingReceivablesEqualToGreaterThan90DaysPastDueMember2023-12-310000084839us-gaap:FinancialAssetPastDueMember2024-12-310000084839us-gaap:FinancialAssetPastDueMember2023-12-310000084839rol:FinancialAssetCurrentMember2024-01-012024-12-310000084839rol:FinancialAssetCurrentMember2023-01-012023-12-310000084839us-gaap:FinancingReceivables30To59DaysPastDueMember2024-01-012024-12-310000084839us-gaap:FinancingReceivables30To59DaysPastDueMember2023-01-012023-12-310000084839us-gaap:FinancingReceivables60To89DaysPastDueMember2024-01-012024-12-310000084839us-gaap:FinancingReceivables60To89DaysPastDueMember2023-01-012023-12-310000084839us-gaap:FinancingReceivablesEqualToGreaterThan90DaysPastDueMember2024-01-012024-12-310000084839us-gaap:FinancingReceivablesEqualToGreaterThan90DaysPastDueMember2023-01-012023-12-310000084839us-gaap:FinancialAssetPastDueMember2024-01-012024-12-310000084839us-gaap:FinancialAssetPastDueMember2023-01-012023-12-310000084839us-gaap:BuildingMember2024-12-310000084839us-gaap:BuildingMember2023-12-310000084839us-gaap:EquipmentMember2024-12-310000084839us-gaap:EquipmentMember2023-12-310000084839us-gaap:FurnitureAndFixturesMember2024-12-310000084839us-gaap:FurnitureAndFixturesMember2023-12-310000084839us-gaap:ComputerEquipmentMember2024-12-310000084839us-gaap:ComputerEquipmentMember2023-12-310000084839rol:PlantAndEquipmentMember2024-12-310000084839rol:PlantAndEquipmentMember2023-12-310000084839us-gaap:LandMember2024-12-310000084839us-gaap:LandMember2023-12-310000084839us-gaap:SoftwareDevelopmentMember2024-12-310000084839us-gaap:SoftwareDevelopmentMember2023-12-310000084839srt:MinimumMemberus-gaap:VehiclesMember2024-12-310000084839srt:MaximumMemberus-gaap:VehiclesMember2024-12-310000084839us-gaap:VehiclesMember2024-12-310000084839us-gaap:CustomerContractsMembersrt:MinimumMember2024-12-310000084839us-gaap:CustomerContractsMembersrt:MaximumMember2024-12-310000084839us-gaap:CustomerContractsMember2024-01-012024-12-310000084839us-gaap:CustomerContractsMember2023-12-310000084839us-gaap:TrademarksAndTradeNamesMembersrt:MinimumMember2024-12-310000084839us-gaap:TrademarksAndTradeNamesMembersrt:MaximumMember2024-12-310000084839us-gaap:TrademarksAndTradeNamesMember2024-12-310000084839us-gaap:TrademarksAndTradeNamesMember2023-12-310000084839us-gaap:TrademarksAndTradeNamesMember2024-01-012024-12-310000084839us-gaap:TrademarksAndTradeNamesMember2024-12-310000084839us-gaap:TrademarksAndTradeNamesMember2023-12-310000084839us-gaap:NoncompeteAgreementsMembersrt:MinimumMember2024-12-310000084839us-gaap:NoncompeteAgreementsMembersrt:MaximumMember2024-12-310000084839us-gaap:PatentsMember2024-12-310000084839us-gaap:OtherIntangibleAssetsMember2024-01-012024-12-310000084839us-gaap:OtherIntangibleAssetsMember2024-12-310000084839us-gaap:OtherIntangibleAssetsMember2023-12-310000084839us-gaap:FairValueInputsLevel2Member2024-12-310000084839us-gaap:FairValueInputsLevel2Member2023-12-310000084839us-gaap:FairValueInputsLevel2Memberus-gaap:OtherCurrentAssetsMember2024-12-310000084839us-gaap:FairValueInputsLevel2Memberus-gaap:OtherNoncurrentAssetsMember2024-12-310000084839us-gaap:FairValueInputsLevel2Memberus-gaap:OtherCurrentAssetsMember2023-12-310000084839us-gaap:FairValueInputsLevel2Memberus-gaap:OtherNoncurrentAssetsMember2023-12-310000084839us-gaap:FairValueInputsLevel3Memberus-gaap:FairValueMeasurementsRecurringMember2024-12-310000084839us-gaap:FairValueInputsLevel3Memberus-gaap:FairValueMeasurementsRecurringMember2023-12-310000084839us-gaap:FairValueInputsLevel3Memberus-gaap:FairValueMeasurementsRecurringMember2022-12-310000084839us-gaap:FairValueInputsLevel3Memberus-gaap:FairValueMeasurementsRecurringMember2023-01-012023-12-310000084839us-gaap:FairValueInputsLevel3Memberus-gaap:FairValueMeasurementsRecurringMember2024-01-012024-12-310000084839us-gaap:RevolvingCreditFacilityMember2023-02-240000084839rol:SwingLineLoansMemberus-gaap:RevolvingCreditFacilityMember2023-02-240000084839rol:TranchesTermLoanMemberus-gaap:RevolvingCreditFacilityMember2023-02-240000084839us-gaap:RevolvingCreditFacilityMemberus-gaap:InterestRateFloorMember2023-02-242023-02-240000084839us-gaap:RevolvingCreditFacilityMemberus-gaap:FederalFundsEffectiveSwapRateMember2023-02-242023-02-240000084839us-gaap:RevolvingCreditFacilityMemberrol:OneMonthSecuredOvernightFinancingRateSOFRMembersrt:MinimumMember2023-02-242023-02-240000084839us-gaap:RevolvingCreditFacilityMemberrol:OneMonthSecuredOvernightFinancingRateSOFRMembersrt:MaximumMember2023-02-242023-02-240000084839us-gaap:RevolvingCreditFacilityMemberrol:OneMonthSecuredOvernightFinancingRateSOFRMember2023-02-242023-02-240000084839us-gaap:RevolvingCreditFacilityMember2023-02-242023-02-240000084839us-gaap:RevolvingCreditFacilityMemberus-gaap:SecuredOvernightFinancingRateSofrOvernightIndexSwapRateMembersrt:MinimumMember2023-02-242023-02-240000084839us-gaap:RevolvingCreditFacilityMemberus-gaap:SecuredOvernightFinancingRateSofrOvernightIndexSwapRateMembersrt:MaximumMember2023-02-242023-02-240000084839us-gaap:LineOfCreditMember2024-01-012024-12-310000084839us-gaap:LineOfCreditMember2024-12-310000084839us-gaap:LetterOfCreditMember2024-12-310000084839us-gaap:LetterOfCreditMember2023-12-310000084839rol:FourZeroOne401KPlanMember2024-01-012024-12-310000084839rol:FourZeroOne401KPlanMemberrol:DefinedContributionEligibleCompensationPercentageOneMember2024-01-012024-12-310000084839rol:FourZeroOne401KPlanMemberrol:DefinedContributionEligibleCompensationPercentageTwoMembersrt:MinimumMember2024-01-012024-12-310000084839rol:FourZeroOne401KPlanMemberrol:DefinedContributionEligibleCompensationPercentageTwoMembersrt:MaximumMember2024-01-012024-12-310000084839rol:FourZeroOne401KPlanMember2023-01-012023-12-310000084839rol:FourZeroOne401KPlanMember2022-01-012022-12-310000084839us-gaap:FairValueInputsLevel1Member2024-12-310000084839us-gaap:FairValueInputsLevel3Member2024-12-310000084839us-gaap:FairValueMeasuredAtNetAssetValuePerShareMember2024-12-310000084839us-gaap:FairValueInputsLevel1Member2023-12-310000084839us-gaap:FairValueInputsLevel3Member2023-12-310000084839us-gaap:FairValueMeasuredAtNetAssetValuePerShareMember2023-12-310000084839rol:NonqualifiedDeferredCompensationPlanMember2024-12-310000084839rol:NonqualifiedDeferredCompensationPlanMember2023-12-310000084839rol:FourZeroOne401KPlanMemberrol:DefinedContributionEligibleCompensationPercentageTwoMember2024-01-012024-12-310000084839rol:LORIncMember2023-09-112023-09-1100000848392023-09-110000084839us-gaap:OverAllotmentOptionMemberrol:LORIncMember2023-09-112023-09-110000084839us-gaap:CommonStockMember2023-09-112023-09-110000084839us-gaap:CommonStockMember2023-09-110000084839rol:TimeLapseRestrictedSharesAndPerformanceShareUnitAwardsMembersrt:MinimumMember2024-01-012024-12-310000084839rol:TimeLapseRestrictedSharesAndPerformanceShareUnitAwardsMembersrt:MaximumMember2024-01-012024-12-310000084839rol:TimeLapseRestrictedSharesAndPerformanceShareUnitAwardsMember2024-01-012024-12-310000084839rol:TimeLapseRestrictedSharesAndPerformanceShareUnitAwardsMember2023-01-012023-12-310000084839rol:TimeLapseRestrictedSharesAndPerformanceShareUnitAwardsMember2022-01-012022-12-310000084839rol:TimeLapseRestrictedSharesAndPerformanceShareUnitAwardsMember2024-12-310000084839rol:TimeLapseRestrictedSharesAndPerformanceShareUnitAwardsMember2023-12-310000084839rol:TimeLapseRestrictedSharesAndPerformanceShareUnitAwardsMember2021-12-310000084839rol:TimeLapseRestrictedSharesAndPerformanceShareUnitAwardsMember2022-12-310000084839rol:EmployeeStockPurchasePlan2022Member2022-04-262022-04-260000084839rol:EmployeeStockPurchasePlan2022Member2022-04-260000084839rol:EmployeeStockPurchasePlan2022Member2022-07-012022-12-310000084839rol:EmployeeStockPurchasePlan2022Member2024-01-012024-12-310000084839rol:EmployeeStockPurchasePlan2022Member2023-01-012023-12-310000084839rol:EmployeeStockPurchasePlan2022Member2022-01-012022-12-310000084839us-gaap:AccumulatedDefinedBenefitPlansAdjustmentMember2021-12-310000084839us-gaap:AccumulatedTranslationAdjustmentMember2021-12-310000084839us-gaap:AccumulatedNetUnrealizedInvestmentGainLossMember2021-12-310000084839us-gaap:AccumulatedDefinedBenefitPlansAdjustmentMember2022-01-012022-12-310000084839us-gaap:AccumulatedTranslationAdjustmentMember2022-01-012022-12-310000084839us-gaap:AccumulatedNetUnrealizedInvestmentGainLossMember2022-01-012022-12-310000084839us-gaap:AccumulatedDefinedBenefitPlansAdjustmentMember2022-12-310000084839us-gaap:AccumulatedTranslationAdjustmentMember2022-12-310000084839us-gaap:AccumulatedNetUnrealizedInvestmentGainLossMember2022-12-310000084839us-gaap:AccumulatedDefinedBenefitPlansAdjustmentMember2023-01-012023-12-310000084839us-gaap:AccumulatedTranslationAdjustmentMember2023-01-012023-12-310000084839us-gaap:AccumulatedNetUnrealizedInvestmentGainLossMember2023-01-012023-12-310000084839us-gaap:AccumulatedDefinedBenefitPlansAdjustmentMember2023-12-310000084839us-gaap:AccumulatedTranslationAdjustmentMember2023-12-310000084839us-gaap:AccumulatedNetUnrealizedInvestmentGainLossMember2023-12-310000084839us-gaap:AccumulatedDefinedBenefitPlansAdjustmentMember2024-01-012024-12-310000084839us-gaap:AccumulatedTranslationAdjustmentMember2024-01-012024-12-310000084839us-gaap:AccumulatedNetUnrealizedInvestmentGainLossMember2024-01-012024-12-310000084839us-gaap:AccumulatedDefinedBenefitPlansAdjustmentMember2024-12-310000084839us-gaap:AccumulatedTranslationAdjustmentMember2024-12-310000084839us-gaap:AccumulatedNetUnrealizedInvestmentGainLossMember2024-12-310000084839rol:StateAndLocalAndForeignJurisdictionMember2024-12-310000084839us-gaap:ForeignCountryMember2024-12-310000084839us-gaap:StateAndLocalJurisdictionMember2024-12-310000084839srt:BoardOfDirectorsChairmanMemberrol:PIALLCMemberrol:LearLeaseAgreementMember2014-01-012014-12-310000084839srt:BoardOfDirectorsChairmanMemberrol:PIALLCMemberrol:LearLeaseAgreementMember2023-01-012023-12-310000084839srt:BoardOfDirectorsChairmanMemberrol:PIALLCMemberrol:LearLeaseAgreementMember2022-01-012022-12-310000084839srt:DirectorMemberrol:GWRLLCMemberrol:G450LeaseArrangementMember2023-08-012023-08-310000084839srt:DirectorMemberrol:GWRLLCMemberrol:G450LeaseArrangementMember2024-01-012024-12-310000084839srt:DirectorMemberrol:LORIncMemberrol:PilotSharingAgreementMember2024-09-300000084839srt:DirectorMemberrol:LORIncMemberrol:PilotSharingAgreementMember2024-01-012024-12-310000084839srt:DirectorMemberrol:LORIncMemberrol:PilotSharingAgreementMember2023-01-012023-12-310000084839srt:DirectorMemberrol:LORIncMemberrol:PilotSharingAgreementMember2022-01-012022-12-310000084839srt:DirectorMemberrol:LORIncMemberrol:RentAndAdministrativeServicesAgreementMember2024-01-012024-12-310000084839srt:DirectorMemberrol:LORIncMemberrol:RentAndAdministrativeServicesAgreementMember2023-01-012023-12-310000084839srt:DirectorMemberrol:LORIncMemberrol:RentAndAdministrativeServicesAgreementMember2022-01-012022-12-310000084839rol:WilsonPestManagementMemberrol:JohnWillsonIvMemberrol:FranchiseAgreementMember2019-12-010000084839us-gaap:RelatedPartyMemberrol:WilsonPestManagementMemberrol:FranchiseAgreementMember2024-01-012024-12-310000084839us-gaap:CommonStockMember2023-09-062023-09-0600000848392023-09-062023-09-060000084839us-gaap:InvestorMemberrol:RegistrationRightsAgreementMember2023-06-052023-06-050000084839us-gaap:InvestorMemberrol:RegistrationRightsAgreementMember2023-06-050000084839us-gaap:CommonStockMember2024-01-012024-12-310000084839us-gaap:CommonStockMember2023-01-012023-12-310000084839us-gaap:CommonStockMember2022-01-012022-12-310000084839rol:TimeLapseRestrictedSharesMember2024-01-012024-12-310000084839rol:TimeLapseRestrictedSharesMember2023-01-012023-12-310000084839rol:TimeLapseRestrictedSharesMember2022-01-012022-12-310000084839us-gaap:RestrictedStockMember2024-01-012024-12-310000084839us-gaap:RestrictedStockMember2023-01-012023-12-310000084839us-gaap:RestrictedStockMember2022-01-012022-12-310000084839rol:ReportableSegmentMember2024-01-012024-12-310000084839rol:ReportableSegmentMember2023-01-012023-12-310000084839rol:ReportableSegmentMember2022-01-012022-12-310000084839country:US2023-12-310000084839us-gaap:SubsequentEventMember2025-01-222025-01-2200000848392024-10-012024-12-310000084839rol:ElizabethB.ChandlerMember2024-10-012024-12-310000084839rol:OfficerTradingArrangementMemberrol:ElizabethB.ChandlerMember2024-12-310000084839rol:ThomasDTeshMember2024-10-012024-12-310000084839rol:OfficerTradingArrangementMemberrol:ThomasDTeshMember2024-12-310000084839rol:OfficerTradingArrangementMemberrol:ElizabethB.ChandlerMember2024-10-012024-12-310000084839rol:OfficerTradingArrangementMemberrol:ThomasDTeshMember2024-10-012024-12-31
UNITED STATES
SECURITIES AND EXCHANGE COMMISSION
Washington, D.C. 20549
_____________________________
FORM 10-K
(Mark One) | | | | | |
x | ANNUAL REPORT PURSUANT TO SECTION 13 OR 15(d) OF THE SECURITIES EXCHANGE ACT OF 1934 |
For the fiscal year ended December 31, 2024
OR
| | | | | |
o | TRANSITION REPORT PURSUANT TO SECTION 13 OR 15(d) OF THE SECURITIES EXCHANGE ACT OF 1934 |
For the transition period from ___________ to ___________
Commission file No. 1-4422
_____________________________
ROLLINS, INC.
(Exact name of registrant as specified in its charter)
_____________________________
| | | | | |
Delaware | 51-0068479 |
(State or other jurisdiction of
incorporation or organization) | (I.R.S. Employer Identification No.) |
| |
2170 Piedmont Road, N.E., Atlanta, Georgia | 30324 |
| (Address of principal executive offices) | (Zip Code) |
Registrant’s telephone number, including area code: (404) 888-2000
Securities registered pursuant to Section 12(b) of the Act:
| | | | | | | | | | | | | | |
| Title of each class | | Trading Symbol(s) | | Name of each exchange on which registered |
| Common Stock, $1 Par Value | | ROL | | The New York Stock Exchange |
Securities registered pursuant to section 12(g) of the Act: None.
Indicate by check mark if the registrant is a well-known seasoned issuer, as defined in Rule 405 of the Securities Act. Yes o No x
Indicate by check mark if the registrant is not required to file reports pursuant to Section 13 or Section 15(d) of the Act. Yes o No x
Indicate by check mark whether the Registrant (1) has filed all reports required to be filed by Section 13 or 15(d) of the Securities Exchange Act of 1934 during the preceding 12 months (or for such shorter period that the Registrant was required to file such reports), and (2) has been subject to such filing requirements for the past 90 days. Yes x No o
Indicate by check mark whether the registrant has submitted electronically every Interactive Data File required to be submitted pursuant to Rule 405 of Regulation S-T (§ 232.405 of this chapter) during the preceding 12 months (or for such shorter period that the registrant was required to submit such files). Yes x No o
Indicate by check mark whether the registrant is a large accelerated filer, an accelerated filer, a non-accelerated filer, a smaller reporting company, or an emerging growth company. See the definitions of “large accelerated filer,” “accelerated filer,” “smaller reporting company,” and “emerging growth company” in Rule 12b-2 of the Exchange Act.
| | | | | | | | | | | | | | | | | |
Large Accelerated Filer | x | | Accelerated filer | o | |
| Non-accelerated filer | o | | Smaller reporting company | o | |
| | | Emerging growth company | o | |
If an emerging growth company, indicate by check mark if the registrant has elected not to use the extended transition period for complying with any new or revised financial accounting standards pursuant to Section 13(a) of the Exchange Act. o
Indicate by check mark whether the registrant has filed a report on and attestation to its management’s assessment of the effectiveness of its internal control over financial reporting under Section 404(b) of the Sarbanes-Oxley Act (15 U.S.C.7262(b)) by the registered public accounting firm that prepared or issued its audit report. Yes x No o
If securities are registered pursuant to Section 12(b) of the Act, indicate by check mark whether the financial statements of the registrant included in the filing reflect the correction of an error to previously issued financial statements. ☐
Indicate by check mark whether any of those error corrections are restatements that required a recovery analysis of incentive-based compensation received by any of the registrant’s executive officers during the relevant recovery period pursuant to §240.10D-1(b). o
Indicate by check mark whether the registrant is a shell company (as defined in Rule 12b-2 of the Exchange Act). Yes o No x
The aggregate market value of Rollins, Inc. Common Stock held by non-affiliates on June 30, 2024 was $13,610,264,265 based on the reported last sale price of common stock on June 28, 2024, which is the last business day of the registrant’s most recently completed second fiscal quarter.
Rollins, Inc. had 484,224,958 shares of Common Stock outstanding as of January 31, 2025.
DOCUMENTS INCORPORATED BY REFERENCE
Portions of the Proxy Statement for the 2025 Annual Meeting of Stockholders of Rollins, Inc. are incorporated by reference into Part III, Items 10-14 of this Form 10-K to the extent described herein.
Rollins, Inc.
Form 10-K
For the Year Ended December 31, 2024
Table of Contents
PART I
Item 1. Business
General Overview
Rollins, Inc. (“Rollins,” “we,” “us,” “our,” or the “Company”), is an international services company headquartered in Atlanta, Georgia. Through our family of leading brands, we provide essential pest and wildlife control services and protection against termite damage, rodents and insects to more than two million residential and commercial customers from more than 800 Company-owned and franchised locations in approximately 70 countries. Over the course of our lengthy operating history, we have garnered a reputation for providing great customer service. The contracted and recurring nature of our services provide us with visibility into a significant portion of our future revenue.
In 1964, brothers O. Wayne and John Rollins acquired Orkin Exterminating Company and in 1965 we changed our name from Rollins Broadcasting, Inc to Rollins, Inc. In 1968, Rollins began trading on the New York Stock Exchange under the symbol “ROL.” Since then, we have grown into a premier consumer and commercial services business with numerous industry leading brands including the world renowned Orkin, as well as HomeTeam Pest Defense, Clark Pest Control, Western Pest Services, Critter Control Wildlife, Northwest Exterminating, and Fox Pest Control, among others.
Pest control generally consists of assessing a customer's property for conditions that invite pests, tackling current infestations, and stopping the life cycle to prevent future invaders. Termite protection programs include liquid treatments, wet and dry foam applications, termite baiting and wood treatments. We operate under one reportable segment which contains our three service offerings:
•Residential: Pest control services protecting residential properties from common pests, including rodents, insects and wildlife;
•Commercial: Workplace pest control solutions for customers across diverse end markets such as healthcare, food service, logistics; and
•Termite and Ancillary: Termite protection services and ancillary services (wildlife exclusion, crawlspace encapsulation and moisture remediation, insulation) for both residential and commercial customers.
Risk factors associated with our business are discussed in Item 1.A. "Risk Factors."
Our Strategic Objectives
We regularly assess the business environment, as well as our own strengths and opportunities, and have aligned around key strategic objectives that will help us to drive continued success for Rollins.
People First
We promote a people first mindset that prioritizes the well-being and development of the individual, as well as our collective team, in all aspects of our business. To provide our customers with the best customer experience, we must focus on cultivating our position as the employer of choice in our industry. This means not only investing in competitive wages and benefits, but also providing tools, training and development opportunities that drive a high level of teammate engagement.
Customer Loyalty
We focus on creating the best customer experience that will enable a loyal customer base and in turn reduce the amount of churn across our customer base. This starts with our people and the interactions they have with our customers. By focusing on this key objective, we expect it to enable growth that will outpace our market growth.
Growth Mindset
A growth mindset helps us consider ways to improve and best position our business. Our focus here is to identify changes that may present both risks and opportunities to our business. We focus on evaluating changes in the markets we compete
in but also across other industries to continue to identify changing dynamics that may impact our people and our customers that may impact our position in the markets we compete.
Operational Efficiency
As a complement to our growth mindset, our dedication to continuous improvement and operational efficiency is another key tenet of our strategy and culture. We approach our operations from the perspective that everything we do can be improved upon. We are constantly striving to improve our service levels by optimizing our business model and modernizing our business.
We believe that our alignment around the key strategic areas will enable us to grow faster than our market, position our business for the future, and deliver value for all stakeholders, including our customers, our teammates, our communities and our shareholders.
Our Competitive Strengths
Rollins is a leader in the global pest control market. We have established a portfolio of premier brands with extensive service capabilities across a deep operating network with a focus on our core pest control market. Our scale enables delivery of great service and provides a significant and reinforcing competitive advantage through (i) comprehensive capabilities to win new residential and commercial accounts, (ii) technology investments for operations optimization and enhanced customer experience, (iii) a diverse portfolio of brands of varying sizes of which to innovate, test, learn, and grow or expand, particularly when it comes to emerging technology, (iv) route density to manage variable costs, and (v) financial flexibility to generate organic growth and pursue acquisitions.
Robust Operating Platform with Proprietary Technology
Our extensive footprint creates an efficient and scalable operating platform to facilitate exceptional customer service delivery, increased cross-selling opportunities, and cost efficiencies. We have strategically invested in proprietary routing and scheduling technologies to increase our competitive advantage, which includes real-time service tracking and customer internet communication to personalize the customer experience. The majority of our business runs on our proprietary Branch Operating Support System (“BOSS”), which offers a back-end interface to facilitate service tracking and payment processing for technicians. BOSS also provides virtual route management tools to increase route efficiency across our network, reducing miles driven and associated costs while increasing customer retention through on-time and rapid response service. We have made investments to evolve and modernize BOSS capabilities to standardize for efficiency, while continuing to deliver differentiating and exceptional customer and employee experiences. Additionally, InSite, a proprietary web reporting capability unique to our commercial customers, provides a competitive advantage and supports the growth of our commercial division.
Differentiated Employee Base and Service Delivery
Our teammates are critical to delivering an outstanding customer experience, and we are highly focused on providing our team with best-in-class training and development opportunities. We operate the 27,000 square foot Rollins Learning Center training facility located in Atlanta, GA, which is a distance-learning and global broadcast facility with simulated environments and classrooms for training. In addition to in-person training, the Rollins Learning Center offers on-demand training sessions that teammates can access from anywhere in the world that are produced at our on-site, state-of-the-art broadcast studio. Our unique programs contribute to our position as an employer of choice and have earned us recognition from Training magazine among the Top 125 U.S. Training Companies 17 times in the past 22 years. We continuously monitor co-worker engagement and customer loyalty.
Experienced Management Team
Our management team combines extensive business and consumer services experience with robust local pest control leadership. Consistent with our culture of attracting, developing and progressing talented individuals, our senior leadership team consists of a combination of long-term internal leaders and strategic hires from well-respected external platforms.
Our Executive Chairman Emeritus, Gary Rollins, is the son of Rollins, Inc. co-founder O. Wayne Rollins and has spent his entire career with the Company, serving as Chief Executive Officer (“CEO”) from 2001 to 2022 and Executive Chairman
from 2020 to 2024. John Wilson, having served in various roles of increasing responsibility at the Company for over 27 years, currently serves as Executive Chairman of the Company effective January 1, 2025.
Jerry Gahlhoff, Jr. currently serves as President and CEO. Mr. Gahlhoff joined the Company as part of the HomeTeam acquisition in 2008. Mr. Gahlhoff has extensive knowledge of the Company’s business and industry, having served in various roles of increasing responsibility at HomeTeam and the Company, collectively, for over 23 years. He is also a trained Entomologist.
Additional members of our Executive Leadership Team include:
•Kenneth Krause has served as the Executive Vice President and Chief Financial Officer of the Company since September 2022. Mr. Krause brings over nine years of public company Chief Financial Officer experience and over 21 years of global finance and strategy experience.
•Elizabeth Chandler joined the Company in 2013 and currently serves as our Chief Legal Officer. Ms. Chandler brings over 36 years of legal experience.
•Pat Chrzanowski, President of Orkin US, joined the Company in 2007 and has over 22 years of pest control experience.
•Stanford Phillips, President of Rollins Brands, joined the Company in 2017 and has over 20 years of pest control experience.
•Thomas Tesh joined the Company in 2012 and currently serves as Senior Group Vice President and Chief Administrative Officer. Mr. Tesh brings over 24 years of pest control experience.
•Renee Pearson joined the Company in 2023 and currently serves as Group Vice President and Chief Information Officer. Ms. Pearson brings over 20 years of information technology leadership experience.
•Clay Scherer joined the Company in 2024 and currently serves as Group Vice President, Technical Services. Mr. Scherer brings over 30 years of global pest markets experience.
•Jamie Benton joined the Company in 2014 and currently serves as Group Vice President, Human Resources. Mr. Benton brings 22 years of Human Resources experience.
International Business
We continue to expand our international presence through organic growth, acquisitions, and our international franchise programs. In 2024, we saw revenue growth in our company-owned operations in Canada, Australia, the United Kingdom, and Singapore. We believe geographic diversity allows us to increase brand recognition, meet demands of global customers, and draw on business and technical expertise from teams in several countries, and offers us an opportunity to access new markets.
Franchising Programs
We have franchise programs through Orkin, Critter Control, MissQuito, and our Australian subsidiaries. We had a total of 140 domestic franchise agreements as of December 31, 2024. International franchise agreements totaled 87 as of December 31, 2024. Transactions with our franchises involve sales of territories and customer contracts to establish new franchises and the payment of initial franchise fees and royalties by franchisees. The territories, customer contracts and initial franchise fees are typically paid for by a combination of cash and notes.
Acquisition Strategy
We have extensive experience acquiring companies of all sizes. Over the last three years, we have completed 99 acquisitions, including 44 acquisitions in 2024. Our acquisition strategy targets high quality, profitable businesses with strong leadership, a healthy level of brand awareness, and customer loyalty in the markets they serve that would benefit from incremental growth capital and have the potential to achieve organic growth and margin expansion.
Seasonality
Our business is affected by weather conditions, including climate change and the seasonal nature of our pest and termite control services. The increase in pest presence and activity, as well as the metamorphosis of termites in the spring and summer (the occurrence of which is determined by the timing of the change in seasons), has historically resulted in an increase in the revenue of our pest and termite control operations during such periods as evidenced by the following table.
| | | | | | | | | | | | | | | | | |
| Consolidated Net Revenues |
| (in thousands) | 2024 | | 2023 | | 2022 |
| First Quarter | $ | 748,349 | | | $ | 658,015 | | | $ | 590,680 | |
| Second Quarter | 891,920 | | | 820,750 | | | 714,049 | |
| Third Quarter | 916,270 | | | 840,427 | | | 729,704 | |
| Fourth Quarter | 832,169 | | | 754,086 | | | 661,390 | |
| Year to date | $ | 3,388,708 | | | $ | 3,073,278 | | | $ | 2,695,823 | |
Our quarterly profitability correlates with our revenue due to seasonality, as profit is lower in the first and fourth quarters and higher in the second and third quarters.
Materials and Supplies
Our Company has relationships with a vast network of national pest control product distributors, manufacturers and other suppliers for pest and termite treatment products. We maintain a sufficient level of products, materials, and other supplies to fulfill our immediate servicing needs and to mitigate any potential short-term shortage in availability from our national network of suppliers. We also have qualified comparable products and materials for key categories to have alternatives ready as needed. However, at any time supply chain disruptions that are more than short-term in nature could impact our levels of products, materials and other supplies. We proactively work with our supplier base and in 2024, we hosted a Partner Summit, with over 30 of our top suppliers in attendance at our corporate headquarters, to enhance collaboration and strategic relationships.
Competition
We operate in a highly competitive environment with fragmented markets and low barriers to entry. The principal factors of competition in our pest and termite control markets are quality and speed of service, customer proximity, customer satisfaction, brand awareness and reputation, terms of guarantees, safety, technical proficiency and price. Due to our strong direct partnerships with product manufacturers, distributors, and visibility into the inventories, ordering and distribution of materials and supplies, we are able to foresee potential supply disruptions and to quickly adapt. The use of an innovative and industry changing distribution model and technology enables us to maintain adequate supplies for our field operations without a significant investment in warehousing and inventory.
We believe that, through our wholly-owned subsidiaries, we compete effectively and favorably with our competitors as one of the world’s largest pest and termite control companies. Our major competitors include Rentokil, Ecolab, Anticimex, and numerous other regional and local companies.
Research and Development
Our expenditures on research activities relating to the development of new products or services are not significant. We utilize the relationships with our manufacturers and materials suppliers to provide new and innovative products and services, coupled with in-depth reviews by our tenured Entomology Department to confirm they meet our strict requirements. We also conduct evaluations of new products with the specific manufacturers of such products and we rely on research performed by leading universities.
We maintain close relationships with several universities for research and validation of treatment procedures and material selection. Some of the new and improved service methods and products are also researched, developed and produced by unaffiliated universities and companies with a portion of these methods and products being produced to the specifications provided by us.
Human Capital
We believe one of the largest contributors to our Company’s success is the quality of our people. Attracting, developing and retaining high-quality talent is the primary objective of our human capital management strategy. The development and retention of high-quality talent enables a better customer experience and improved customer retention. We develop and engage our people through our training at all levels of our organization.
As of December 31, 2024, the Company had 20,265 employees. Approximately 18,270 of our employees were located in the United States, with approximately 16,250 employees at U.S. branch offices. Of the U.S. employees, less than 2% are represented by a labor union or covered by a collective bargaining agreement.
| | | | | | | | | | | | | | | | | |
| At December 31, | 2024 | | 2023 | | 2022 |
| Employees | 20,265 | | 19,031 | | 17,515 |
Leadership Development
Each Rollins brand cultivates its own leadership development programs that support its own values and culture while considering the best practices of all Rollins brands. Our leaders are trained on the fundamentals of people leadership, business acumen, sales excellence, and technical expertise. Having the right leaders at all levels of our organization is critical to our current and future success. This includes establishing effective succession planning to support our business growth plans. While each of our brands is focused on developing operational leadership capabilities that are brand-specific, Rollins is focused on developing overall leadership capabilities through our Region Manager Development Program (RMDP). The RMDP is a comprehensive leadership development program for mid-level leaders across the organization who lead multiple business units or departments and those preparing to lead at that level. The 12-month program offers a blended learning approach that includes facilitator-led training, executive and peer mentoring, immersive field learning experiences, 360-degree assessments, a 6-month executive coaching engagement, and supported individualized development plans. Since the program was established in 2018, we have graduated a total of 112 senior leaders in six different RMDP classes with continued successes.
Workplace Inclusion
We make it a priority to promote and create an inclusive workplace that results in higher levels of satisfaction and engagement, stronger staff retention, higher productivity, and a heightened sense of belonging. Our mission is to foster a culture of inclusion, where all individuals feel respected, are treated fairly, with an opportunity to excel.
Our Workplace Inclusion (WPI) mission to build an inclusive workplace has continued under the guidance of our Executive Sponsor and Inclusion Advisory Council which is made up of teammates from Rollins brands across the United States. In January 2022, we hired a Director of WPI. The Director’s primary role is to implement the WPI Strategic Plan (the “Plan”) which was approved by the Executive Leadership team in April of 2022. In April of 2024, we integrated responsibility for Workplace Inclusion to our Talent Management department, and in June of 2024, we hired a Senior Manager of Workplace Inclusion.
The Plan includes 5 Strategic Focus Areas to be implemented across all brands. The 5 Strategic Focus areas are Training & Education, Talent Acquisition & Career Development, Policies & Programs, Communication, and Employee Resource Groups (ERGs).
Our ERGs, led by Rollins teammates, are inclusive to all and represent our employee population. Each ERG provides a platform for teammates to connect, collaborate, and advocate for their shared interests and experiences. These groups promote inclusivity, provide networking opportunities, and contribute to a sense of belonging among teammates. We have established five ERGs:
•R-Collective: Strives to improve company culture and teammate engagement and retention through multigenerational networking.
•Women+ Resource Community: Provides a resource for women+ at any career level to achieve their goals and celebrate their accomplishments resulting in an enhanced work experience at Rollins.
•Women's Impact Network (WIN): Increases communication between the women of Orkin by providing opportunities for professional development, mentoring, and networking.
•PRIDE: Provides a network that supports the professional development of LGBTQ+ teammates and allies, promotes recruitment and retention, and builds community.
•P.E.A.C.E.: Promoting Equality, Acceptance and Cultural Empowerment through networking, team building, and allyship to foster an inclusive and respectful environment that celebrates the diverse cultures represented within the workforce.
We are excited about the accomplishments on our journey to create a workplace of inclusion and will continue to execute on the strategic plan.
Health and Safety
We are committed to the health and safety of our teammates, customers and communities where we work, live and play. Rollins undertakes a variety of efforts to support the health and well-being of our teammates, including their physical and mental health. This includes investing in competitive compensation and benefits while also providing the culture, tools, training and development opportunities to make working at Rollins an enjoyable and rewarding experience. Adapting to feedback provided by our teammates about the needs of themselves and their families, in 2023, we increased our investment in mental health and wellness services that are offered at no cost. Other benefits include our Employee Stock Purchase Program (ESPP), personal finance education and advisory services, assistance programs to help with managing personal and work-life challenges, family support programs, and educational assistance.
In 2022, we formed a partnership with Marathon Health (formerly Everside Health) to build an on-site medical clinic at our Rollins Support Center in Atlanta. That clinic provides no-cost primary care to Rollins teammates who participate in one of our medical plans in the state of Georgia. Marathon Health provides these services either virtually or through the existing nationwide network of Marathon Health clinics for all our teammates participating in one of our insurance plans in the U.S. This is an enhanced medical benefit, provided at no cost to teammates.
We motivate our teammates to be leaders in safety by continuously evaluating and improving our safety performance, implementing best practices, monitoring regulations and encouraging safety excellence in everything we do. We set measurable safety goals and have made improvements so that our tracking is timely and user friendly for our field leaders. In 2024, we continued our focus on improving driver safety scores. These scores are calculated using an application that monitors driving behaviors once a vehicle is in motion, detecting positive and negative driving maneuvers related to acceleration, braking, distractions, and speed. This resulted in improvement in our average driver safety score for 2024. In addition, we launched several training programs for our new teammates focused on driver safety as well as general safety onboarding.
We have an established safety governance structure that helps our company prioritize measures to progressively reduce motor vehicle collision and injury-related risk. We have established an ongoing process that requires commitment, communication, and collaboration at all levels of the organization. Our structure is designed to support effectiveness and alignment with our organization’s goals and objectives.
We review and refine our health and safety policies and procedures on an ongoing basis so that they remain efficient and relevant for our business.
Community Involvement
We are a family of brands that has always upheld service – to our teammates, customers, and communities – as a cornerstone. While each of our diverse brands has their own culture of service, we are firmly united in our commitment to engaging with our local communities.
We offer teammates the opportunity to participate in various community outreach programs. Our brands work closely with their local communities to create an impact through outreach, volunteerism, and donations. Our overarching goal is to create a significant impact in local communities over an extended period of time. We believe everyone deserves a safe place to live, work, and play.
Since 1985, we have partnered with the United Way of Greater Atlanta through employee and company-matching funds, helping make Rollins a community leader for many years. Rollins ranked #8 in the top 25 corporate contributors in both 2024 and 2023 compared to ranking #7 and #9 in 2022 and 2021, respectively. Rollins is proud to be #6 in corporate contributors to United Way’s Child Well-Being Mission Fund for 2024.
Along with personal contributions from teammates, the Company hosts rallies, golf tournaments, contests, and silent auctions to raise funds for the United Way of Greater Atlanta, as well as other local organizations it supports. Rollins has contributed approximately $1 million annually for each of the past 5 years in support of local community outreach.
We have a partnership with the Grove Park Foundation (the “Foundation”) to help serve our Atlanta community. The partnership allows our teammates to volunteer and support the Foundation, which is committed to neighborhood revitalization, education programs, and job training that improves the quality of life in the Grove Park neighborhood, a predominantly African American community. Our support helps fund both a volunteer coordinator for the Foundation and community service events hosted for the citizens of Grove Park. Teammates from our Atlanta family of brands participate in volunteer opportunities in the Grove Park neighborhood throughout the year.
Our Orkin brand demonstrates its culture of service through its OrkinServes program, which is designed to help take care of communities through employee volunteer opportunities. In 2022, OrkinServes introduced five new Division Advocates to serve as a voice for volunteering within their divisions across the United States and Canada. Similarly, our Northwest Exterminating brand developed the Northwest Good Deed Team ("GDT") in 2011 with the focus of being active and involved in the communities where they serve. Led by two full-time teammates, the GDT works with local organizations across six states and is supported by our team across Northwest.
Regulatory Considerations
Our business is subject to various local and national legislative and regulatory enactments including, but not limited to, environmental laws, antitrust laws, employment and benefit laws (including wage and hour laws, payroll taxes, anti-discrimination laws, pension laws and regulations, and ERISA), immigration laws, motor vehicle laws and regulations, human health and safety laws, securities laws including, but not limited to, SEC regulations, and federal, state and local laws and regulations governing worker safety and the pest and termite control industry. If we were to fail to comply with any of these applicable laws or regulations, we could be subject to substantial fines or damages, be involved in lawsuits, enforcement actions and other claims by third parties or governmental authorities, suffer losses to our reputation and our business or suffer the loss of licenses or penalties that may affect how the business is operated.
Consumer Protection, Privacy and Solicitation Matters
We are subject to international, federal, state, provincial and local laws and regulations designed to protect consumers generally, including laws governing lending, debt collection and consumer finance; consumer privacy and fraud; collection and use of consumer data; laws governing billing practices and contract renewals; telemarketing; and other forms of solicitation. Specifically, rules adopted by the Federal Communications Commission and Federal Trade Commission, including the Telephone Consumer Protection Act and the Telemarketing Sales Rule, along with state laws and other legal authorities, govern our telephone and texting sales practices. The CAN-SPAM Act regulates our email solicitations, and the Consumer Review Fairness Act regulates consumer opinions on social media regarding our products and services. The California Consumer Privacy Act, including amendments under the California Privacy Rights Act, and laws in other states provide consumers and sometimes employees the right to know what personal data businesses collect, how the data is used, and give them the right to access, delete and opt out of the sale of their personal information to third parties. We are subject to some of these states’ laws depending on the number of customers or amount of revenue in the specific state. Similarly, we are bound by foreign laws and regulations governing data protection in the United Kingdom (UK General Data Protection Regulation and Data Protection Act 2018; Canada (Personal Information Protection and Electronic Documents Act); Australia (Privacy Act and its Australian Privacy Principles); and Singapore (Personal Data Protection Act and Spam Control Act), when applicable.
Environmental, Health and Safety Matters
Specifically, our businesses are subject to various international, federal, state and local laws and regulations regarding environmental, health and safety matters. Among other things, these laws regulate the emission or discharge of materials into the environment, govern the use, storage, treatment, disposal, transportation and management of hazardous substances and wastes and protect the health and safety of our employees. In addition, the use of certain pesticide products is also
regulated by various federal, state, provincial and local environmental and public health agencies. These laws also impose liability for the costs of investigating and remediating, and damages resulting from, present and past releases of hazardous substances, including releases by prior owners or operators of sites we currently own or operate. Compliance with environmental, health and safety laws increases our operating costs, limits or restricts the services we provide and subjects us to the possibility of regulatory or private actions or proceedings. Penalties for noncompliance with these laws may include criminal sanctions or civil remedies, including, but not limited to, cancellation of licenses, fines, and other corrective actions. Noncompliance with, changes in, expanded enforcement of, or adoption of new laws and regulations governing hazardous waste disposal and other environmental matters, could result in operational changes and increased costs.
Franchise Matters
Certain of our subsidiaries are subject to various international, federal, state, provincial and local laws and regulations governing franchise sales, marketing and licensing and franchise trade practices generally, including applicable rules and regulations of the Federal Trade Commission. These laws and regulations generally require disclosure of business information in connection with the sale and licensing of our franchises. Certain state regulations also affect our ability as a franchisor to revoke or refuse to renew a franchise. From time to time, we and one or more franchisees have been, and may in the future become, involved in a dispute regarding the franchise relationship, including payment of royalties or fees, location of branches, advertising, purchase of products by franchisees, non-competition covenants, compliance with our standards or franchise renewal criteria.
Employment Laws
We are subject to a myriad of complex laws and regulations in the various federal, state, provincial, regional, and local governments in the countries in which we operate related to employees, including, but not limited to wage and hour laws, anti-discrimination laws, immigration, pension benefit plans, ERISA laws, and retirement benefits. Any failure to comply with such applicable laws or regulations could result in fines or legal proceedings.
Intellectual Property
We rely on a combination of intellectual property rights, including a patent, trademarks, copyrights, trade secrets, and contractual provisions to protect our intellectual property. Our worldwide intellectual property portfolio is strengthened through innovation and brand recognition, and a comprehensive approach for protection and enforcement.
We protect and promote our intellectual property portfolio and take those actions we deem appropriate to enforce our intellectual property rights and to defend our rights both domestically and internationally. Although in the aggregate, our global portfolio of more than 450 trademarks is a valuable asset that is important to our operations, we believe that our competitive advantage is also largely attributable to the technical, marketing, and sales competence and capabilities of our teammates, rather than on any individual trademark; however, the loss of the Orkin trademark could be material to our business as a whole.
Available Information
Our Annual Reports on Form 10-K, Quarterly Reports on Form 10-Q, Current Reports on Form 8-K and amendments to these reports, are available free of charge on our website at www.rollins.com, under the heading “SEC Filings,” as soon as reasonably practicable after those reports are electronically filed with or furnished to the Securities and Exchange Commission (“SEC”).
Item 1.A. Risk Factors
An investment in our common stock involves certain risks. Before making an investment decision, you should carefully consider the following risks and all of the other information included in this Annual Report on Form 10-K. Our business, reputation, financial condition, results of operations, or cash flows could be materially adversely affected by any of these risks. The trading price of our common stock could decline due to any of these risks, and you may lose all or part of your investment. This Annual Report on Form 10-K also contains forward-looking statements that involve risks and uncertainties. Our actual results could differ materially from those anticipated in these forward-looking statements as a result of certain factors, including the risks faced by us described below and elsewhere in this Annual Report on Form 10-K. You are cautioned that the risk factors discussed below are not exhaustive.
Risks Related to our Business, Brand, Industry and Operations
We face risks regarding our ability to compete in the pest control industry in the future.
We operate in a highly competitive industry with fragmented markets and low barriers to entry. Our revenues and earnings are affected by changes in competitors’ services, markets, and prices and general economic issues. We compete with other large pest control companies, as well as numerous smaller pest control companies and do-it-yourself options, for a finite number of customers. We believe that the principal competitive factors in the market areas that we serve are quality and speed of service, customer proximity, customer satisfaction, brand awareness and reputation, terms of guarantees, technical proficiency and price. Although we believe that our customer experience and quality service are excellent, we cannot assure investors that we will be able to maintain our competitive position in the future.
We may not be able to identify, complete or successfully onboard acquisitions or guarantee that any acquisitions will achieve the anticipated financial benefits.
Acquisitions have been and may continue to be an important element of our business strategy. We cannot assure investors that we will be able to identify and acquire acceptable acquisition targets on terms favorable to us in the future, that we will receive necessary regulatory approvals, or that any acquisitions will achieve the anticipated financial benefits. Our inability to achieve the anticipated financial benefits from any acquisition transactions may not be realized due to any number of factors, including, but not limited to, unsuccessful onboarding efforts, unexpected or underestimated liabilities or increased costs, fees, expenses and charges related to such transactions. Such adverse events could result in a decrease in the estimated fair value of goodwill or other intangible assets established as a result of such transactions, triggering an impairment.
Our business depends on our strong brands, and failing to maintain and enhance our brands and develop a positive client reputation and experience could hurt our ability to retain and expand our base of customers.
Our strong brands, such as Orkin, HomeTeam Pest Defense, Clark Pest Control, Northwest Exterminating, Fox Pest Control, Trutech, Western Pest Services, The Industrial Fumigant Company (IFC), Waltham Services, Okolona Pest Control (OPC), and Critter Control, have significantly contributed to the success of our business. Maintaining and enhancing our brands increases our ability to enter new markets and launch new and innovative services that better serve the needs of our customers. Our brands may be negatively impacted by a number of factors, including, among others, reputational issues, product/technical failures, and customer experience. We continue to develop strategies and innovative tools to gain a deeper understanding of customer acquisition and retention in order to more effectively expand and retain our customer base. Maintaining and enhancing our brands will depend largely on our brands’ ability to remain service leaders and continue to provide high-quality pest control services that are truly beneficial and play a meaningful role in people’s lives.
Labor shortages, our ability to attract and retain skilled workers, and increased labor costs may impair growth potential and profitability.
Our ability to remain productive and profitable will depend substantially on our ability to compete with other pest control and service companies to attract, adequately train, and retain skilled workers and key employees (including executive officers), and create leadership opportunities. Our ability to expand our operations is in part impacted by our ability to increase our labor force. The demand for employees is high, and the supply is limited. Ongoing labor shortages could negatively affect our ability to efficiently operate at full capacity or lead to increased costs, such as increased overtime to meet demand and increased wage rates to attract and retain employees. A significant increase in the wages paid and benefits offered by competing employers could also result in a reduction in our labor force, increases in our labor costs, or both. Prolonged labor shortages, increased turnover or labor inflation could diminish our profitability and impair our growth potential.
In addition, decisions and rules by the National Labor Relations Board, including “expedited elections” and restrictions on appeals, has and could continue to lead to increased organizing activities at our brands. If these labor organizing activities are successful, it could further increase labor costs, decrease operating efficiency and productivity in the future, or otherwise disrupt or negatively impact our operations which could have a material adverse effect on our reputation and business.
We may experience difficulties integrating, streamlining and optimizing our information technology (“IT”) systems and processes.
We have invested in, and expect to continue to invest in, new systems and technology to implement new or improve existing business capabilities and streamline business processes, financial reporting, and acquisition integration. Many of these efforts impact customers, suppliers, employees, and others, and any disruption or failure could adversely affect our business and operations. We may experience significant delays, increased costs, and other difficulties, which could adversely affect our ability to process work orders, send invoices, track, and collect payments, fulfill contractual obligations, or otherwise operate our business in compliance with laws. In addition, our efforts to centralize various business processes within our organization in connection with the implementations may disrupt operations. We may also experience difficulties, costs or delays in migrating acquired businesses to our systems, processes, and technologies.
Distributor or supply chain issues may result in product shortages or disruptions to our business.
We have a complex global network of distributors and suppliers that has expanded to meet increased customer demand and may, in the future, further evolve in response to market conditions. Although the majority of the products we use are generally available from multiple sources, and alternatives have been generally available in the event of disruption in the past, we could experience material disruptions in production, transportation, labor disputes, and other supply chain issues on specific products, which could result in out-of-stock conditions, and our results of operations and relationships with customers could be adversely affected (a) if new or existing distributors or suppliers are unable to meet any standards that we set or that are set by government or industry regulations or customers, (b) if we are unable to contract with distributors or suppliers at the quantity, quality and price levels needed for our business, or (c) if any of our key distributors or suppliers has shipping disruptions or becomes insolvent, ceases or significantly reduces its operations or experiences financial distress.
Our inability to fully or substantially meet customer demand due to distributor or supply chain issues could result in, among other things, unmet consumer demand leading to reduced preference for our products or services in the future, customers' purchasing services from competitors, strained customer relationships, termination of customer contracts, additional competition and new entrants into the market, and loss of potential sales and revenue.
Climate change and unfavorable weather conditions could adversely impact our financial results.
Our operations are directly impacted by the weather conditions worldwide, including catastrophic events, natural disasters and potential impacts from climate change. Our business is also affected by extreme weather such as hurricanes, wildfires, and other storms which can impact our ability to operate as well as drought which can greatly reduce the pest population for extended periods. Climate change continues to receive increasing global attention. The possible effects of climate change could include changes in rainfall patterns, water shortages, changing storm patterns and intensities, changing temperature levels, as well as changes in legislation, regulation, and international accords, all of which could adversely impact our costs and business operations. Our business is also affected by seasonality associated with our pest and termite control services. The increase in pest presence and activity, as well as the metamorphosis of termites in the spring and summer (the occurrence of which is determined by the timing of the change in seasons), has historically resulted in an increase in the revenue and income of our pest and termite control operations during such periods.
We may not successfully execute our business strategies, including achieving our growth objectives.
We may not be able to fully implement our business strategies or realize, in whole or in part within the expected time frames, the anticipated benefits of various growth or other initiatives. Our ability to implement our business strategy may be adversely affected by factors that we cannot foresee currently, such as unanticipated costs and expenses, global health crises, technological change, recession and economic slowdown, the level of interest rates, foreign exchange risks, our inability to effectively manage and implement change, failure to onboard acquisitions, or a decline in the effectiveness of our marketing (including digital marketing) efforts.
In addition, we will incur certain costs to achieve efficiency improvements, systems implementations, and growth in our business, and we may not meet anticipated implementation timetables or stay within budgeted costs. As these initiatives are implemented, we may not fully achieve the desired results, including but not limited to, expected cost savings or growth rates, and these initiatives may adversely impact customer retention or our operations. Also, our business strategies may change in light of our ability to implement new business initiatives, competitive pressures, economic uncertainties or developments or other factors.
We currently conduct business in international markets, our planned further expansion into international markets presents unique challenges, and our expansion efforts with respect to international operations may not be successful.
We currently conduct business in international markets, with approximately 7% of our 2024 revenues derived from our international operations. In addition, a key element of our business strategy includes further expansion in international markets. Our ability to operate successfully in international markets may be adversely affected by political, economic and social conditions beyond our control and geopolitical conflicts, such as the conflict between Russia and Ukraine and the conflict in Gaza. Also, we may be adversely affected by local laws and customs and legal and regulatory constraints, including compliance with applicable export, anti-corruption and currency laws and regulations of the countries or regions in which we currently operate or intend to operate in the future. Risks inherent in our existing and future international operations also include, among others, the costs and difficulties of managing international operations, difficulties in identifying and gaining access to local distributors and suppliers, suffering possible adverse tax consequences from changes in tax laws or the unfavorable resolution of tax assessments or audits, maintaining product quality and greater difficulty in enforcing intellectual property rights. Additionally, foreign currency exchange rates and fluctuations could have an adverse effect on our financial results.
Our franchisees, subcontractors, and vendors could take actions that could harm our business.
Our franchisees, subcontractors, and vendors are contractually obligated to operate their businesses in accordance with the standards set forth in our agreements with them and applicable laws and regulations. Each of our brands that are franchised also provides training and support to franchisees. However, franchisees, subcontractors, and vendors are independent third parties that we do not control, and who own, operate and oversee the daily operations of their respective businesses, and the ultimate success of any business operation rests with the business owner. If franchisees do not successfully operate their businesses in a manner consistent with required standards, royalty payments owed to us will be adversely affected and our brands’ image and reputation could be harmed. Similarly, if franchisees, subcontractors, and vendors do not successfully operate their businesses in a manner consistent with required laws, standards and regulations, we could be subject to claims from regulators or legal claims for the actions or omissions of such third-party franchisees, subcontractors, and vendors. In addition, our relationship with our franchisees, subcontractors, and vendors could become strained (including resulting in litigation) as we impose new standards or assert more rigorous enforcement practices of the existing required standards.
Risks Related to Cybersecurity, Privacy Compliance and Business Disruptions
The Company, our brands, third-party business partners and service providers have been subject to cybersecurity incidents in the past and could be the targets of future attacks that could result in disruption to our business operations, economic and reputational damage, and possible fines, penalties and private litigation. These could include unauthorized access to or unintentional distribution of personal, financial, proprietary, confidential, or other protected data or information the Company is entrusted to keep about its customers, employees, business practices, or third parties; significant operational disruptions that result from a cybersecurity incident; or vulnerabilities through the use of evolving tools such as Artificial Intelligence.
Our internal IT systems contain certain personal, financial, health, or other protected and confidential information that is entrusted to us by our customers and employees. Our IT systems also contain our and our brands’ proprietary and other confidential information related to our business, such as business plans, customer lists, pricing, and service development initiatives. From time to time, we integrate new IT systems due to organic growth and acquisitions. In addition, we grant third-party business partners and service providers access to confidential information in order to facilitate business operations and administer employee benefits. Employees, third-party business partners, and service providers can knowingly or unknowingly disseminate such information or serve as an entry point for bad actors to access such information.
The Company has assigned responsibility for Board oversight of cybersecurity risk to the Audit Committee, which monitors the cybersecurity risk management and cyber control functions, including external security audits, and receives periodic updates from experienced senior management, outside legal counsel, and cybersecurity insurance carriers knowledgeable about assessing and managing cyber risks, including, as appropriate, updates on the prevention, detection, mitigation, and remediation of cyber incidents.
We continue to evaluate and modify our systems and protocols for data security compliance purposes, and such standards may change from time to time. We have processes in place to oversee and identify cybersecurity risks and vulnerability related to certain third-party business partners, vendors, and service providers. We have processes to address risks of a key
service provider experiencing a significant cybersecurity incident that renders their services unavailable, but those processes may not cover all business losses. Activities by bad actors, changes in computer and software capabilities and encryption technology, new tools and discoveries, cloud applications, changes in multi-jurisdictional regulations, and other events or developments may result in a compromise or breach of our systems. Any compromises, breaches, application errors or human mistakes related to our systems or failures to comply with applicable standards could not only disrupt our financial operations, including our customers’ ability to pay for our services and products by credit card or their willingness to purchase our services and products, but could also result in violations of applicable laws, regulations, orders, industry standards or agreements and subject us to costs, penalties and liabilities. A breach of data security or failure to comply with rigorous multi-jurisdictional consumer privacy requirements could expose us to customer litigation, regulatory actions and costs related to the reporting and handling of such a violation or breach. Furthermore, while we maintain cybersecurity insurance, our insurance may not cover all liabilities incurred due to a security breach or incident.
Risks Related to Legal, Regulatory and Risk Management Matters
In the countries in which we operate, our business is subject to various federal, state, provincial, and local laws and regulations pertaining to environmental, public health and safety matters, including those related to the pest control industry, and any noncompliance with, changes to, or increased enforcement of such laws, could significantly impact our business.
Our business is subject to various federal, state, provincial, and local laws and regulations pertaining to environmental, public health and safety matters, including those related to the pest control industry. Among other things, these laws also govern the use, storage, treatment, disposal, transportation and management of certain pesticides and hazardous substances and waste and regulate the emission or discharge of materials into the environment. In addition, the use of certain pesticide products is also regulated by various federal, state, provincial and local environmental and public health agencies. Penalties for noncompliance with these laws may include criminal sanctions or civil remedies, including, but not limited to, cancellation of licenses, fines, and other corrective actions. Noncompliance with, changes in, expanded enforcement of, or adoption of new laws and regulations governing hazardous waste disposal and other environmental matters, could result in operational changes and increased costs.
We are subject to regulation in the countries in which we operate related to employment laws, and noncompliance could lead to fines or legal proceedings.
We are subject to a myriad of complex laws and regulations in the various federal, state, provincial, regional, and local governments in the countries in which we operate related to employees, including, but not limited to wage and hour laws, anti-discrimination laws, immigration, pension benefit plans, ERISA laws, OSHA regulations, and retirement benefits. Any failure to comply with such applicable laws or regulations could result in fines or legal proceedings.
New or proposed regulations regarding climate change could have uncertain impacts on our business.
Climate change has been the subject of increased focus by various governmental authorities and regulators around the world. For example, the State of California has enacted legislation that will require large U.S. companies doing business in California to make broad-based climate-related disclosures, and other states are also considering similar measures. Also, the SEC has issued final rules, which are currently stayed pending judicial review; however, if implemented as proposed, these rules would significantly increase our climate-related disclosure obligations. We are assessing our obligations under these proposed and enacted rules in the United States and around the world and expect that compliance could require substantial effort in the future. Compliance with any new or more stringent laws or requirements, or stricter interpretations of existing laws, could require additional expenditures by us or our suppliers. We cannot predict how the proposed rules, if finalized, or any future legislation or regulations pertaining to climate change, will ultimately affect our business.
Termite claims and lawsuits related thereto could increase our legal expenses.
From time to time, we are subject to claims brought by our customers for termite protection services, generally based on alleged termite damage to the structure(s) covered by our contracts with those customers. In some instances of these claims, the customer may initiate litigation or arbitration proceedings against us or one of our brands.
Our safety and risk management programs may not have the intended effect of reducing our liability for employee-work related injuries, third party-liability claims or property loss.
Our auto or other safety management system and performance measures are critical to our reputation and results of operation. We attempt to mitigate risks relating to employee work-related injuries, automobile collision, third-party liability, or property loss through the implementation of company-wide safety management programs designed to focus on prevention and decrease the occurrence of incidents or events that may occur. Such incidents could also have the effect of destabilizing or increasing our insurance costs and financial reserves. Incidents involving injury or property loss may be caused by multiple potential factors, a significant number of which are beyond our control. Therefore, there is no guarantee that our safety and risk management and safety programs will have the desired effect of avoiding or controlling all potential expenses and liability exposure.
Additionally, we retain certain risks related to general liability, workers’ compensation, and auto liability. The accruals and reserves we hold are based on estimates that involve a degree of judgment and are inherently variable and could be overestimated or insufficient. If actual claims exceed our estimates, our operating results could be materially affected, and our ability to take timely corrective actions to limit future costs may be limited.
Further, some of our commercial customers require that we meet certain safety criteria to be eligible to provide service and bid for contracts, and many contracts provide for automatic termination or forfeiture of some or all of our contract fees or profit in the event we fail to meet certain measures. Accordingly, if we fail to maintain adequate safety standards, we could experience reduced profitability or the loss of projects or clients.
Our insurance coverage may be inadequate to cover all significant risk exposures and our accruals and reserves for uninsured claims are variable.
We are exposed to liabilities that are unique to our business and the services we provide. We maintain commercial liability insurance that extends to products liability. In addition, we also maintain other insurance and other traditional risk transfer tools to respond to certain types of liabilities and risks. However, such tools are subject to terms such as deductibles, retentions, limits and policy exclusions, commercial availability and supply of coverage as well as risk of denial of coverage, default or insolvency. If we experience unexpected or uncovered losses, or if any of our insurance policies are terminated for any reason or are not effective in mitigating our risks, we may incur losses that are not covered or that exceed our coverage limits. In addition, there can be no assurance that the types or levels of coverage maintained are adequate to cover these potential significant and catastrophic risks. Further, we may not be able to continue to maintain our existing insurance coverage or obtain comparable or additional insurance coverage at a reasonable cost in the event a significant product or service claim arises.
We have been and may in the future be subject to lawsuits, investigations and other proceedings which could have a material adverse effect on our business.
In the normal course of business, we have been and may in the future be involved in various claims, contractual disputes, investigations, arbitration and litigation, including (1) claims that our acts, omissions, services or vehicles caused damage or injury, (2) claims that our pest control, termite and/or ancillary services did not achieve the desired results, (3) claims related to acquisitions, (4) claims related to violations of antitrust laws or consumer protection laws, (4) claims related to allegations by federal, state or local authorities, including the Securities and Exchange Commission, the Federal Trade Commission and Department of Justice, of violations of regulations or statutes, (5) claims related to federal securities laws, (6) claims related to employment or wage and hour violations, including class actions under the California Private Attorney General Act ("PAGA"), (7) claims related to environmental matters, and (8) claims related to additional laws and regulations. These claims, proceedings or litigation, either alone or in the aggregate, could have a material adverse effect on our business.
Risks Related to Certain Intellectual Property Rights
Our brand recognition or reputation could be impacted if we are not able to adequately protect our intellectual property and other proprietary rights that are material to our business.
Our ability to compete effectively depends in part on our rights to service marks, trademarks, trade names and other intellectual property rights we own or license. Although we have sought to register or protect many of our marks either in the United States or in the countries in which they are or may be used, we have not sought to protect our marks in every
country. Furthermore, because of the differences in foreign trademark, patent and other intellectual property or proprietary rights laws, we may not receive the same protection in other countries as we would in the United States. If we are unable to protect our proprietary information and brand names, we could suffer a material adverse effect to our reputation and business. Litigation may be necessary to enforce our intellectual property rights and protect our proprietary information, or to defend against claims by third parties that our products, services or activities infringe their intellectual property rights.
Risks Related to Public Health Crises
The effects of a pandemic or other major public health concern, could materially impact our business.
The impact of a pandemic or other major public health concerns, including changes in consumer behavior and discretionary spending, market downturns, and restrictions on business and individual activities, could create significant volatility in the global economy. Additionally, government or regulatory responses to pandemics or other public health concerns, such as mandatory lockdowns, vaccine mandates or other restrictions on operations, could negatively impact our business.
The ultimate impact of a pandemic or other major public health concern also depends on events beyond our knowledge or control, including the duration and severity of such pandemics and other major public health concerns, and related remedial or containment measures taken by parties other than us to respond to them.
We are unable to completely predict the full impact that a pandemic, or other major public health concern will have on our business due to numerous uncertainties. In addition, our compliance with remedial or containment measures could impact our day-to-day operations and could disrupt our business and operations, as well as that of our customers and suppliers, for an indefinite period of time. Furthermore, labor force availability may be impaired due to exposure, reluctance to comply with governmental, regulatory or contractual mandates, or other restrictions, which could negatively affect our operating costs and profitability or negatively impact our ability to provide quality services.
Risks Related to Market Conditions and External Factors
Adverse economic conditions, including inflation and restrictions in customer discretionary expenditures, increases in interest rates or other disruptions in credit or financial markets, geopolitical developments, increases in fuel prices, raw material costs, or other operating costs could materially adversely affect our business.
Economic downturns may adversely affect our commercial customers, including food service, hospitality and food processing industries whose business levels are particularly sensitive to adverse economies. For example, we may lose commercial customers and related revenues because of consolidation or cessation of commercial businesses or because these businesses switch to a lower cost provider. Pest and termite services represent discretionary expenditures to many of our residential customers. If consumers restrict their discretionary expenditures, due to inflation or other economic hardships, we may suffer a decline in revenues from our residential service lines. Disruptions in credit or financial markets could make it more difficult for us to obtain, or increase the cost of obtaining, financing in the future. Increases in interest rates may cause a reduction in new home construction or real estate transactions, which could result in a decrease in revenue. We may be impacted by geopolitical tensions and conflicts, including changes to trade policies and regulations, such as tariffs. In addition, there can be no assurances that fuel prices, raw material costs, or other operating costs, all of which may be subject to inflationary pressures, will not materially increase in future years.
Risks Related to our Capital and Ownership Structure
A group that includes members of the Company’s Board of Directors and management has a significant ownership interest; public stockholders may have no effective voice in the Company’s management.
The Company has a significant shareholder group, which includes the Company’s Executive Chairman Emeritus of the Board, Gary W. Rollins, Board member, Pam Rollins, and certain persons acting as a group with them (the “Significant Shareholder”) which as of December 31, 2024, beneficially held (in the aggregate, including direct and indirect ownership) approximately 42 percent of our common stock. As a result, the Significant Shareholder has significant influence over our operations, including the election of directors, approval of substantial corporate transactions such as acquisitions, and approval of matters requiring stockholder approval. This concentration of ownership could also have the effect of delaying or preventing a third party from acquiring control of the Company at a premium.
The Significant Shareholder has a substantial ownership interest, and the availability of the Company’s common stock to the investing public may be limited.
The availability of Rollins’ common stock to the investing public is limited to those shares not held by the Significant Shareholder, which could negatively impact Rollins’ stock trading prices and affect the ability of minority stockholders to sell their shares. Future sales or other transactions entered into by the Significant Shareholder with respect to all or a portion of their shares or otherwise could also negatively affect the trading price of, or cause volatility in the market for, our common stock.
Certain provisions in Rollins, Inc.’s certificate of incorporation and bylaws may inhibit a takeover of the Company.
Rollins, Inc.’s certificate of incorporation, bylaws and other documents contain provisions including advance notice requirements for stockholder proposals and staggered terms for the Board of Directors. These provisions may make a tender offer, change in control or takeover attempt that is opposed by the Company’s Board of Directors more difficult or expensive.
Item 1.B. Unresolved Staff Comments
None.
Item 1.C Cybersecurity
The Company has security incident response policies and procedures for identifying, assessing, and managing material risks arising from cybersecurity incidents, including those arising from third-party service providers. The Company’s Chief Information Security Officer (“CISO”), who has over 30 years of experience in information technology and information security and has several industry certifications, including CISSP, CCSP, CISM, CRISC, and CIPP, is the executive primarily responsible for managing cybersecurity risks. The CISO assesses cybersecurity incidents and classifies them by severity level in accordance with the Company’s Security Incident Guidelines, which determine how each cybersecurity incident is managed and communicated. The Company uses both internal and external resources to assess risk and manage its IT and 24x7 cybersecurity operations, including managed service providers who assist in the support of key business systems. The Company may also periodically engage external consultants to assist with cybersecurity incident management, particularly where advanced or specialized expertise may be required. The Company’s Incident Response and Breach Notification Policy outlines the procedures that the Company follows for evaluation and recovery from an incident, including containment of the affected systems, to restore our systems to normal operations. To date, the Company has not had a cybersecurity event that materially impacted or is reasonably likely to materially affect its business strategy, results of operations, financial condition, or the security of its proprietary data.
The Company has assigned responsibility for Board oversight of cybersecurity risk to the Audit Committee, which monitors the cybersecurity risk management and cyber control functions, including external security audits, and receives periodic updates from experienced senior management, including the CISO, knowledgeable about assessing and managing cyber risks, including, as appropriate, updates on the prevention, detection, mitigation, and remediation of cyber incidents.
Cybersecurity incidents that significantly impact the confidentiality, integrity, or availability of Company data or the reliability of the Company system or network are reported to certain members of the Company’s Executive Leadership Team, including the Chief Executive Officer, Chief Financial Officer, Chief Legal Officer, Chief Administrative Officer, and Chief Information Officer, for assessment of the materiality of the incident, which will be made using both quantitative and qualitative analyses to determine an incident’s immediate and reasonably likely future impacts. Such cybersecurity incidents are also reported to the Audit Committee. Cybersecurity incidents that moderately impact the confidentiality, integrity, or availability of Company data or the reliability of the Company systems or networks are reported to the Security Incident Response Team, for assessment of the materiality of the incident.
Our privacy compliance and digital risk management initiatives focus on the threats and risks to enterprise information and the underlying IT systems processing such information as part of the implementation of business processes. We have also implemented policies and procedures for the assessment, identification, and management of material risks from cybersecurity threats, including internal training, system controls, and monitoring and audit processes to protect the Company from internal and external vulnerabilities and to comply with consumer privacy laws in the areas in which we operate. Further, we limit retention of certain data, encrypt certain data and otherwise protect information to comply with consumer privacy laws in the areas in which we operate. The Company also has a cross-functional group of representatives
from several departments that comprise the Cybersecurity and Privacy Committee, which meets and discusses information at least quarterly related to cybersecurity and privacy compliance at the Company, including training, policies, and trends. We also rely on, among other things, commercially available third parties including vendors, cybersecurity protection systems, software, tools and monitoring to provide security for processing, transmission and storage of protected information and data. The systems currently used for transmission and approval of payment card transactions, and the technology utilized in payment cards themselves, all of which can put payment card data at risk, meet standards set by the payment card industry.
The Company has a global cybersecurity training program that requires all employees with access to the Company networks to participate in regular and mandatory training on how to be aware of, and help defend against, cybersecurity risks. Also, the Company regularly tests the efficacy of its training efforts as well as its systems to assess vulnerabilities to cybersecurity risks, including tabletop incident response exercises.
Annually the Company conducts an Enterprise Risk Assessment during which management identifies and quantifies risks, including cybersecurity risks, that could enhance or impede the Company’s ability to achieve current or future strategic objectives. The conclusions of the annual Enterprise Risk Assessment are shared with the Audit Committee. The CISO also reviews with the Audit Committee the strategy, priorities, and goals of the cybersecurity program.
Item 2. Properties.
The Company’s administrative headquarters are owned by the Company, and are located at 2170 Piedmont Road, N.E., Atlanta, Georgia 30324. The Company owns or leases over 700 branch offices and operating facilities used in its business as well as the Rollins Training Center located in Atlanta, Georgia, and the Pacific Division Administration and Training Center in Riverside, California. None of the branch offices, individually considered, represents a materially important physical property of the Company. The facilities are suitable and adequate to meet the current and reasonably anticipated future needs of the Company.
Item 3. Legal Proceedings.
In the normal course of business, the Company and its subsidiaries are involved in, and will continue to be involved in, various claims, arbitrations, contractual disputes, investigations, litigation, environmental and tax and other regulatory matters relating to, and arising out of, our businesses and our operations. These matters may involve, but are not limited to, allegations that our services or vehicles caused damage or injury, claims that our services did not achieve the desired results (including claims that we are responsible for termite damage to a structure), claims related to acquisitions and allegations by federal, state or local authorities, including taxing authorities, of violations of regulations or statutes. In addition, we are parties to employment-related cases and claims from time to time, which may include claims on a representative or class action basis alleging wage and hour law violations or claims related to the operation of our retirement benefit plans. We are also involved from time to time in certain environmental and tax matters primarily arising in the normal course of business. We evaluate pending and threatened claims and establish loss contingency reserves based upon outcomes we currently believe to be probable and reasonably estimable.
The Company retains, up to specified limits, certain risks related to general liability, workers’ compensation and auto liability. The estimated costs of existing and future claims under the retained loss program are accrued based upon historical trends as incidents occur, whether reported or unreported (although actual settlement of the claims may not be made until future periods) and may be subsequently revised based on developments relating to such claims. The Company contracts with an independent third party to provide the Company an estimated liability based upon historical claims information. The actuarial study is a major consideration in establishing the reserve, along with management’s knowledge of changes in business practice and existing claims compared to current balances. Management’s judgment is inherently subjective as a number of factors are outside management’s knowledge and control. Additionally, historical information is not always an accurate indication of future events. The accruals and reserves we hold are based on estimates that involve a degree of judgment and are inherently variable and could be overestimated or insufficient. If actual claims exceed our estimates, our operating results could be materially affected, and our ability to take timely corrective actions to limit future costs may be limited.
Item 103 of SEC Regulation S-K requires disclosure of certain environmental legal proceedings if the proceeding reasonably involves potential monetary sanctions of $300,000 or more. The Company has received a notice of alleged violations and information requests from local governmental authorities in California for our Orkin and Clark Pest Control operations and is currently working with several local governments regarding compliance with environmental regulations
governing the management of hazardous waste and pesticide disposal. The investigation appears to be part of a broader effort to investigate waste handling and disposal processes of a number of industries. While we are unable to predict the outcome of this investigation, we do not believe the outcome will have a material effect on our results of operations, financial condition, or cash flows.
Management does not believe that any pending claim, proceeding or litigation, regulatory action or investigation, either alone or in the aggregate, will have a material adverse effect on the Company’s financial position, results of operations or liquidity; however, it is possible that an unfavorable outcome of some or all of the matters could result in a charge that might be material to the results of an individual quarter or year.
Item 4. Mine Safety Disclosures.
Not applicable.
PART II
Item 5. Market for Registrant’s Common Equity, Related Stockholder Matters and Issuer Purchases of Equity Securities.
Market Information, Holders, and Dividends
The common stock of the Company is listed on the New York Stock Exchange and is traded on the Philadelphia, Chicago and Boston Exchanges under the symbol ROL.
As of January 31, 2025, there were 8,135 holders of record of the Company’s common stock. However, a large number of our shareholders hold their shares in “street name” in brokerage accounts and, therefore, do not appear on the shareholder list maintained by our transfer agent.
Dividends will be payable only when, and if, declared by our Board and will be subject to our ongoing ability to generate sufficient income and free cash flow, any future capital needs and other contingencies. The Company expects to continue to pay cash dividends to the common stockholders, subject to the earnings and financial condition of the Company and other relevant factors.
Issuer Purchases of Equity Securities
The Company did not repurchase shares on the open market during the quarter ended December 31, 2024.
The following table presents the Company's share repurchase activity for the period from October 1, 2024 to December 31, 2024.
| | | | | | | | | | | | | | | | | | | | | | | | | | |
| Period | | Total number of shares purchased (1) | | Weighted-
average
price paid
per share | | Total number of shares purchased as part of publicly announced repurchases (2) | | Maximum number of shares that may yet be purchased under the repurchase plan (2) |
| October 1 to 31, 2024 | | — | | $ | — | | | — | | 11,415,625 |
| November 1 to 30, 2024 | | — | | — | | | — | | 11,415,625 |
| December 1 to 31, 2024 | | 817 | | 49.86 | | | — | | 11,415,625 |
| Total | | 817 | | $ | — | | | — | | 11,415,625 |
(1)Represents shares withheld by the Company in connection with tax withholding obligations of its employees upon vesting of such employees' restricted stock awards.
(2)The Company has a share repurchase plan, adopted in 2012, to repurchase up to 16.9 million shares of the Company’s common stock. As of December 31, 2024, the Company has a remaining authorization to repurchase 11.4 million shares of the Company's common stock under this program. The repurchase plan has no expiration date.
Performance Graph
The following graph sets forth a five-year comparison of the cumulative total stockholder return based on the performance of the stock of the Company as compared with both a broad equity market index and an industry index. The indices included in the following graph are the S&P 500 Index and the S&P 500 Commercial Services & Supplies Index.
*$100 invested on 12/31/19 in stock or index, including reinvestment of dividends.
Fiscal year ending December 31.
Copyright© 2024 Standard & Poor's, a division of S&P Global. All rights reserved.
| | | | | | | | | | | | | | | | | | | | | | | | | | | | | | | | | | | |
| 2019 | | 2020 | | 2021 | | 2022 | | 2023 | | 2024 |
| Rollins Inc. | $ | 100.00 | | | $ | 178.51 | | | $ | 158.09 | | | $ | 170.87 | | | $ | 207.05 | | | $ | 222.65 | |
| S&P 500 | 100.00 | | | 118.40 | | | 152.39 | | | 124.79 | | | 157.59 | | | 197.02 | |
| S&P 500 Commercial Services & Supplies | 100.00 | | | 120.98 | | | 159.25 | | | 150.76 | | | 193.54 | | | 229.12 | |
Item 6. [Reserved]
Item 7. Management’s Discussion and Analysis of Financial Condition and Results of Operations.
Caution Regarding Forward-Looking Statements
This Annual Report on Form 10-K as well as other written or oral statements by the Company may contain “forward-looking statements” as defined in the Private Securities Litigation Reform Act of 1995. We have based these forward-looking statements on our current opinions, expectations, intentions, beliefs, plans, objectives, assumptions and projections about future events and financial trends affecting the operating results and financial condition of our business. Although we believe that these forward-looking statements are reasonable, we cannot assure you that we will achieve or realize these plans, intentions, or expectations. Generally, statements that do not relate to historical facts, including statements concerning possible or assumed future actions, business strategies, events or results of operations, are forward-looking statements. The words “believe,” “continue,” “could,” “estimate,” “expect,” “intend,” “may,” “might,” “plan,” “possible,” “potential,” “predict,” “should,” “will,” “would,” and similar expressions may identify forward-looking statements, but the absence of these words does not mean that a statement is not forward-looking.
Forward-looking statements in this Annual Report on Form 10-K include, but are not limited to, statements regarding:
•expectations with respect to our financial and business performance and strategy;
•expansion efforts and growth opportunities, including, but not limited to, organic growth and recent and future acquisitions in the United States and in foreign markets where we have a presence and integration efforts with respect to recent acquisitions;
•our belief that we are starting 2025 with favorable demand and demand will continue to be solid;
•our belief that we compete effectively and favorably with our competitors;
•our alignment around the key strategic areas that will enable us to grow faster than our market, position our business for the future, and deliver value for all stakeholders and our ability to execute on our strategic plan;
•the impact of inflation, changing interest rates, tariffs, trade disputes, foreign exchange rate risk, business interruptions due to natural disasters and changes in the weather patterns, seasonality, employee shortages, and supply chain issues;
•our belief that we maintain a sufficient level of products, materials, and other supplies and have qualified comparable products and materials and our ability to foresee potential supply disruptions;
•expectations with respect to new and innovative products and services;
•our approach to human capital management, including training, development, retention, inclusion, and engaging with our local communities;
•continuously improving our safety culture and monitoring safety goals, including, but not limited to, our proactive approach with respect to safety and risk management;
•our policies and procedures that are designed to identify, assess, and manage material risks arising from cybersecurity incidents;
•new information technology systems and technology will lead to new or improving business capabilities and streamline business processes, financial reporting, and acquisition integration;
•expectations with respect to interest costs and effective tax rates;
•our robust pipeline for acquisitions;
•our focus on continuous improvement initiatives to enhance profitability across our business;
•the underlying health of core pest control markets;
•our focus on pricing, ongoing modernization efforts, and a culture of continuous improvement should support healthy incremental margins;
•sufficiency of current cash and cash equivalents balances, future cash flows, and available borrowings under our Credit Facility to finance our current and future operations;
•our belief that the Company has adequate liquid assets, funding sources and insurance accruals to accommodate potential future insurance claims;
•our approach to capital allocation inclusive of our intent to pay cash dividends to common shareholders and to invest in acquisitions;
•our belief that no pending or threatened claim, proceeding, litigation, regulatory action or investigation, either alone or in the aggregate, including, but not limited to, the investigation by certain California governmental authorities regarding compliance with environmental regulations and claims filed under California's Private Attorneys General Act, will have a material adverse effect on our financial position, results of operations or liquidity;
•the suitability and adequacy of our facilities to meet our current and reasonably anticipated future needs; and
•estimates, assumptions, and projections related to our application of critical accounting policies, described in more detail under “Critical Accounting Estimates.”
These forward-looking statements are based on information available as of the date of this report, and current expectations, forecasts, and assumptions, and involve a number of judgments, risks and uncertainties. Important factors could cause actual results to differ materially from those indicated or implied by forward-looking statements including, but not limited to, those described in Item 1A “Risk Factors” of Part I, Item 7 “Management’s Discussion and Analysis of Financial condition and Results of Operations” of Part II, and elsewhere in this Annual Report on Form 10-K for our fiscal year ended December 31, 2024 and may also be described from time to time in our future reports filed with the SEC.
Accordingly, forward-looking statements should not be relied upon as representing our views as of any subsequent date, and we do not undertake any obligation to update forward-looking statements to reflect events or circumstances after the date they were made, whether as a result of new information, future events or otherwise, except as may be required by law.
Presentation
This discussion should be read in conjunction with our audited financial statements and related notes included elsewhere in this document. Discussions of 2022 items and year-to-year comparisons of 2023 and 2022 that are not included in this Form 10-K can be found in “Management’s Discussion and Analysis of Financial Condition and Results of Operations” in Part II, Item 7 of our Annual Report on Form 10-K for the year ended December 31, 2023. The following discussion (as well as other discussions in this document) contains forward-looking statements. Please see “Cautionary Statement Regarding Forward-Looking Statements” and "Risk Factors" for a discussion of uncertainties, risks and assumptions associated with these statements.
The Company
Rollins, Inc. (“Rollins,” “we,” “us,” “our,” or the “Company”), is an international services company headquartered in Atlanta, Georgia that provides pest and termite control services to both residential and commercial customers through its wholly-owned subsidiaries and independent franchises in the United States, Canada, Australia, Europe, and Asia with international franchises in Canada, Central and South America, the Caribbean, Europe, the Middle East, Asia, Africa, and Australia. Our pest and termite control services are performed pursuant to terms of contracts that specify the pricing arrangement with the customer. The Company operates as one reportable segment and the results of operations and its financial condition are not reliant upon any single customer.
Strategic Update
We are focused on continuous improvement throughout the business. During 2024, we made significant strides in all four pillars of our strategic objectives: 1) people first 2) customer loyalty 3) growth mindset and 4) operational efficiency.
People First
We continue to focus on the development of our people. During 2024, we continued to make strategic improvements to both our support functions, as well as the customer-facing side of our business, by hiring and onboarding the right people
into the right roles. Additionally, we upgraded our training and onboarding programs to help improve our overall teammate retention. We remain committed to developing exceptional talent and investing in our teams.
Customer Loyalty
We remain committed to providing our customers with the best customer experience. Effective sales and service staffing levels helped us to capitalize on continued demand and deliver solid results for the year, with organic revenues* growing by 7.9% compared to 2023.
Growth Mindset
2024 marked a record year in terms of revenues, totaling $3.4 billion, an increase of 10.3% over 2023, with acquisition revenues* growing by 3.1% compared to 2023. We completed 44 acquisitions in 2024, including 32 acquisitions and 12 franchise buybacks, driving inorganic growth at our brands both domestically and internationally.
Operational Efficiency
We saw healthy margins in 2024, with gross margin improving 50 basis points to 52.7% in 2024 compared to 52.2% in 2023. Operating margin was 19.4% of revenue, an increase of 40 basis points over 2023 and adjusted operating income margin* was 19.9%, an increase of 20 basis points over the prior year.
*Amounts are non-GAAP financial measures. See the schedules below for definitions and a discussion of non-GAAP financial metrics, including a reconciliation to the most directly comparable GAAP measure.
Impact of Economic Trends
The continued disruption in economic markets due to inflation, changing interest rates, tariffs, trade disputes, business interruptions due to natural disasters and changes in weather patterns, employee shortages, and supply chain issues, all pose challenges which may adversely affect our future performance. The Company continues to execute various strategies previously implemented to help mitigate the impact of these economic disruptors.
However, the Company cannot reasonably estimate whether these strategies will help mitigate the impact of these economic disruptors in the future.
The Company’s consolidated financial statements reflect estimates and assumptions made by management that affect the reported amounts of assets and liabilities and related disclosures as of the date of the condensed consolidated financial statements. The Company considered the impact of economic trends on the assumptions and estimates used in preparing the consolidated financial statements. In the opinion of management, all material adjustments necessary for a fair presentation of the Company’s financial results for the year have been made. These adjustments are of a normal recurring nature but are complicated by the continued uncertainty surrounding these macro economic trends. The severity, magnitude and duration of certain economic trends continue to be uncertain and are difficult to predict. Therefore, our accounting estimates and assumptions may change over time in response to economic trends and may change materially in future periods.
The extent to which changing interest rates, inflation and other economic trends will continue to impact the Company’s business, financial condition and results of operations is uncertain. Therefore, we cannot reasonably estimate the full future impacts of these matters at this time.
Tax Legislation Developments
The Organization for Economic Co-operation and Development ("OECD") has proposed a global minimum tax of 15% of reported profits ("Pillar Two") for multinational enterprises with annual global revenues exceeding €750 million. Pillar Two has been agreed upon in principle by over 140 countries and is intended to apply for tax years beginning in 2024. The OECD has issued administrative guidance (including transitional safe harbor rules) in conjunction with the implementation of the Pillar Two global minimum tax. These rules did not have a material impact on financial results in 2024 due to certain transitional safe harbors. The Company will continue to monitor the potential impact of Pillar Two proposals and developments on our consolidated financial statements and related disclosures as various tax jurisdictions begin enacting such legislation.
Results of Operations—2024 Compared to 2023
| | | | | | | | | | | | | | | | | | | | |
| Twelve Months Ended December 31, |
| | | | | Variance |
| (in thousands, except per share data and margins) | 2024 | | 2023 | | $ | % |
| GAAP Metrics | | | | | | |
| Revenues | $ | 3,388,708 | | | $ | 3,073,278 | | | 315,430 | | 10.3 | |
Gross profit (1) | $ | 1,785,511 | | | $ | 1,603,407 | | | 182,104 | | 11.4 | |
Gross profit margin (1) | 52.7 | % | | 52.2 | % | | | 50 bps |
| Operating income | $ | 657,224 | | | $ | 583,226 | | | 73,998 | | 12.7 | |
| Operating income margin | 19.4 | % | | 19.0 | % | | | 40 bps |
| Net income | $ | 466,379 | | | $ | 434,957 | | | 31,422 | | 7.2 | |
| EPS | $ | 0.96 | | | $ | 0.89 | | | 0.07 | | 7.9 | |
| Net cash provided by operating activities | $ | 607,653 | | | $ | 528,366 | | | 79,287 | | 15.0 | |
| | | | | | |
| Non-GAAP Metrics | | | | | | |
Adjusted operating income (2) | $ | 675,126 | | | $ | 604,217 | | | 70,909 | | 11.7 | |
Adjusted operating margin (2) | 19.9 | % | | 19.7 | % | | | 20 bps |
Adjusted net income (2) | $ | 479,190 | | | $ | 434,142 | | | 45,048 | | 10.4 | |
Adjusted EPS (2) | $ | 0.99 | | | $ | 0.89 | | | 0.10 | | 11.2 | |
Adjusted EBITDA (2) | $ | 771,493 | | | $ | 691,322 | | | 80,171 | | 11.6 | |
Adjusted EBITDA margin (2) | 22.8 | % | | 22.5 | % | | | 30 bps |
Free cash flow (2) | $ | 580,081 | | | $ | 495,901 | | | 84,180 | | 17.0 | |
(1) Exclusive of depreciation and amortization
(2) Amounts are non-GAAP financial measures. See "Non-GAAP Financial Measures" below for a discussion of non-GAAP financial metrics including a reconciliation to the most directly comparable GAAP measure.
The following table presents financial information, including our significant expense categories, for the twelve months ended December 31, 2024 and 2023:
| | | | | | | | | | | | | | |
| Twelve Months Ended December 31, |
| (in thousands) | 2024 | 2023 |
| $ | % of Revenue | $ | % of Revenue |
| Revenue | $ | 3,388,708 | | 100.0 | % | $ | 3,073,278 | | 100.0 | % |
| | | | |
| Less: | | | | |
| Cost of services provided (exclusive of depreciation and amortization below): | | | | |
| Employee expenses | 1,048,992 | | 31.0 | % | 953,600 | | 31.0 | % |
| Materials and supplies | 212,296 | | 6.3 | % | 197,825 | | 6.4 | % |
| Insurance and claims | 68,326 | | 2.0 | % | 60,390 | | 2.0 | % |
| Fleet expenses | 131,898 | | 3.9 | % | 127,390 | | 4.1 | % |
Other cost of services provided (1) | 141,685 | | 4.2 | % | 130,666 | | 4.3 | % |
| Total cost of services provided (exclusive of depreciation and amortization below) | 1,603,197 | | 47.3 | % | 1,469,871 | | 47.8 | % |
| | | | |
| Sales, general and administrative: | | | | |
| Selling and marketing expenses | 427,916 | | 12.6 | % | 375,805 | | 12.2 | % |
| Administrative employee expenses | 313,814 | | 9.3 | % | 291,772 | | 9.5 | % |
| Insurance and claims | 41,434 | | 1.2 | % | 37,946 | | 1.2 | % |
| Fleet expenses | 33,580 | | 1.0 | % | 31,415 | | 1.0 | % |
Other sales, general and administrative (2) | 198,323 | | 5.9 | % | 178,295 | | 5.8 | % |
| Total sales, general and administrative | 1,015,067 | | 30.0 | % | 915,233 | | 29.8 | % |
| | | | |
| Restructuring costs | — | | — | % | 5,196 | | 0.2 | % |
| Depreciation and amortization | 113,220 | | 3.3 | % | 99,752 | | 3.2 | % |
| Interest expense, net | 27,677 | | 0.8 | % | 19,055 | | 0.6 | % |
| Other income, net | (683) | | — | % | (22,086) | | (0.7) | % |
| Income tax expense | 163,851 | | 4.8 | % | 151,300 | | 4.9 | % |
| Net income | $ | 466,379 | | 13.8 | % | $ | 434,957 | | 14.2 | % |
1) Other cost of services provided includes facilities costs, professional services, maintenance and repairs, software license costs, and other expenses directly related to providing services.
2) Other sales, general and administrative includes facilities costs, professional services, maintenance and repairs, software license costs, bad debt expense, and other administrative expenses.
Revenues
The following presents a summary of revenues by service offering:
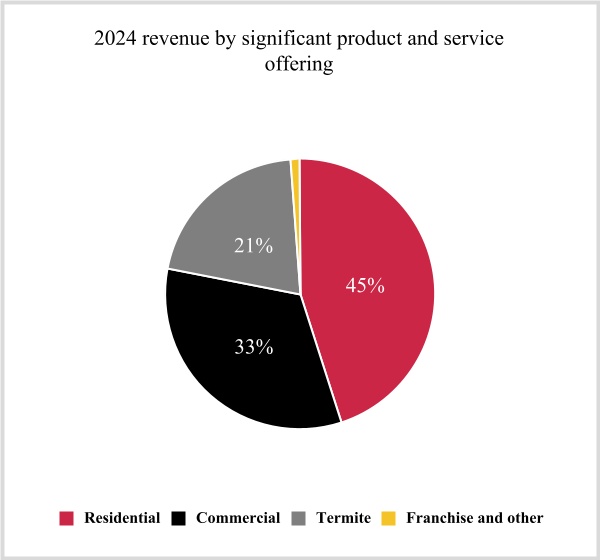
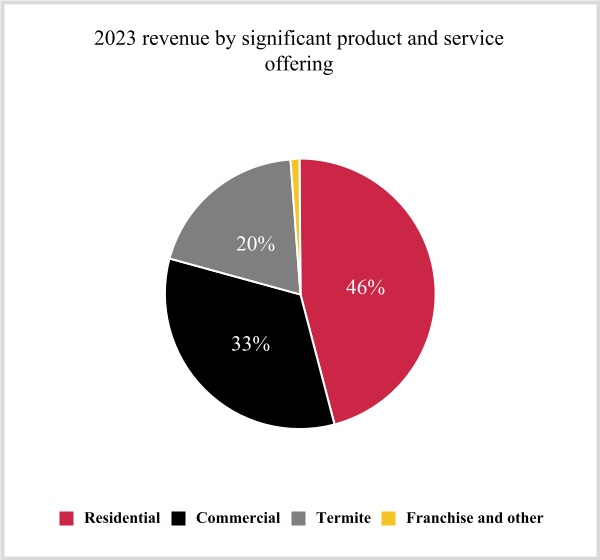
Revenues for the year ended December 31, 2024 were $3.4 billion, an increase of $315.4 million, or 10.3%, from 2023 revenues of $3.1 billion. The increase in revenues was driven by demand from our customers that remained strong throughout the year across all major service offerings. Comparing 2024 to 2023, organic revenue* growth was 7.9% with acquisitions adding 3.1% during the year, offset by divestitures of 0.7%. Residential pest control revenue increased approximately 9%, commercial pest control revenue increased approximately 10% and termite and ancillary services grew approximately 14% including both organic and acquisition-related growth in each area. Organic revenue* growth was strong across our service offerings, growing over 5% in residential, over 8% in commercial, and over 12% in termite and ancillary activity. The Company’s foreign operations accounted for approximately 7% of total revenues for the years ended December 31, 2024 and 2023.
*Amounts are non-GAAP financial measures. See the schedules below for definitions and a discussion of non-GAAP financial metrics, including a reconciliation to the most directly comparable GAAP measure.
Gross Profit (exclusive of Depreciation and Amortization)
Gross profit for the twelve months ended December 31, 2024 was $1.8 billion, an increase of $182.1 million, or 11.4%, compared to $1.6 billion for the year ended December 31, 2023. Gross margin improved 50 basis points to 52.7% in 2024 compared to 52.2% in 2023, as pricing more than offset inflationary pressures. We saw 20 basis points of leverage in fleet and 10 basis points of leverage in materials and supplies, while employee expenses and insurance and claims were flat as a percentage of revenue.
Sales, General and Administrative
For the twelve months ended December 31, 2024, sales, general and administrative (SG&A) expenses increased $99.8 million, or 10.9%, compared to the twelve months ended December 31, 2023. The increase is driven by expenses associated with growth initiatives aimed at capitalizing on the health of our underlying markets.
As a percentage of revenue, SG&A increased 20 basis points to 30.0% in 2024 versus 29.8% in 2023. Selling and marketing costs have increased 40 basis points as we continue to invest in growth initiatives. This was partially offset by 20 basis points of leverage associated with lower administrative costs.
Restructuring Costs
For the twelve months ended December 31, 2024, restructuring costs decreased by $5.2 million. During the twelve months ended December 31, 2023, we executed a restructuring program to modernize our workforce. No such costs were incurred during the twelve months ended December 31, 2024.
Depreciation and Amortization
For the twelve months ended December 31, 2024, depreciation and amortization increased $13.5 million, or 13.5%, compared to the twelve months ended December 31, 2023. The increase was primarily due to higher amortization of intangible assets from acquisitions, most notably from a full year of acquisition costs of FPC Holdings, LLC ("Fox Pest Control", or "Fox").
Operating Income
For the twelve months ended December 31, 2024, operating income increased $74.0 million or 12.7% compared to the prior year. As a percentage of revenue, operating income increased to 19.4% from 19.0% in the prior year. The improvement in operating income as a percentage of revenue is primarily driven by the improvement in gross profit discussed previously.
Interest Expense, Net
During the twelve months ended December 31, 2024, interest expense, net increased $8.6 million compared to the prior year, due to the increase in the average debt balance associated primarily with the share repurchase completed in the third quarter of 2023 and the acquisition of Fox in the second quarter of 2023. This was partially offset by a lower average effective interest rate in 2024 compared to 2023.
Other Income, Net
During the twelve months ended December 31, 2024, other income, net decreased $21.4 million primarily due to the Company recognizing a $15.5 million gain on the sale of certain businesses during 2023, with no such gain on sale during 2024, and lower gains on sales of non-operational assets.
Income Taxes
The Company’s effective tax rate was 26.0% in 2024 compared to 25.8% in 2023. The 2024 rate was negatively impacted by higher state income taxes and foreign income taxes compared to 2023.
General Commentary
Our team delivered a strong finish to the 2024 fiscal year, exceeding our own revenue expectations and delivering healthy earnings growth for the full year. As we look to 2025, demand for our services is solid and our pipeline for acquisitions is robust. We invested meaningfully in our business throughout 2024, which helped accelerate the organic revenue growth* rate in the third and fourth quarter of the year. We are capitalizing on this momentum as we start 2025, while remaining focused on continuous improvement initiatives to enhance profitability across our business.
We saw strong full year growth in revenue, cash flow and earnings in 2024. We delivered double-digit revenue and operating cash flow growth, as well as a 40 basis point improvement in operating margins. Growth investments and pressure from developments on legacy auto claims that materialized in December of 2024 impacted our incremental adjusted EBITDA margin* for the year. Additionally, we continued to execute a balanced capital allocation program enabled by compounding operating cash flow and a strong balance sheet.
*Amounts are non-GAAP financial measures. See the schedules below for definitions and a discussion of non-GAAP financial metrics, including a reconciliation to the most directly comparable GAAP measure.
2025 Outlook
For 2025, the Company anticipates:
•The underlying health of core pest control markets, as well as Rollins’ ongoing commitment to operational execution, should support another year of strong organic revenue growth*, further complemented by a strategic and disciplined approach to acquisitions. We continue to target 7-8 percent organic revenue growth* and a contribution of 2-3 percent from acquisitions.
•A focus on pricing, ongoing modernization efforts, and a culture of continuous improvement should support healthy incremental adjusted EBITDA margins*. While we expect incremental margins to be healthy, we do expect a more challenging first half of 2025 relative to the first half of 2024.
•Compounding operating cash flow and strong balance sheet should continue to enable a balanced capital allocation strategy.
*Amounts are non-GAAP financial measures. See the schedules below for definitions and a discussion of non-GAAP financial metrics, including a reconciliation to the most directly comparable GAAP measure.
Non-GAAP Financial Measures
Reconciliation of GAAP and non-GAAP Financial Measures
A non-GAAP financial measure is a numerical measure of financial performance, financial position, or cash flows that either 1) excludes amounts, or is subject to adjustments that have the effect of excluding amounts, that are included in the most directly comparable measure calculated and presented in accordance with GAAP in the statement of operations, balance sheet or statement of cash flows, or 2) includes amounts, or is subject to adjustments that have the effect of including amounts, that are excluded from the most directly comparable measure so calculated and presented.
These measures should not be considered in isolation or as a substitute for revenues, net income, earnings per share or other performance measures prepared in accordance with GAAP. Management believes all of these non-GAAP financial measures are useful to provide investors with information about current trends in, and period-over-period comparisons of, the Company's results of operations. An analysis of any non-GAAP financial measure should be used in conjunction with results presented in accordance with GAAP.
The Company has used the following non-GAAP financial measures in this Form 10-K:
Organic revenues
Organic revenues are calculated as revenues less the revenues from acquisitions completed within the prior 12 months and excluding the revenues from divested businesses. Acquisition revenues are based on the trailing 12-month revenue of our acquired entities. Management uses organic revenues, and organic revenues by type to compare revenues over various periods excluding the impact of acquisitions and divestitures.
Adjusted operating income and adjusted operating margin
Adjusted operating income and adjusted operating margin are calculated by adding back to net income those expenses resulting from the amortization of certain intangible assets, adjustments to the fair value of contingent consideration resulting from the acquisition of Fox, and restructuring costs related to restructuring and workforce reduction plans. Adjusted operating margin is calculated as adjusted operating income divided by revenues. Management uses adjusted operating income and adjusted operating margin as measures of operating performance because these measures allow the Company to compare performance consistently over various periods.
Adjusted net income and adjusted EPS
Adjusted net income and adjusted EPS are calculated by adding back to the GAAP measures amortization of certain intangible assets, adjustments to the fair value of contingent consideration resulting from the acquisition of Fox Pest Control, and restructuring costs related to restructuring and workforce reduction plans, and excluding gains and losses on the sale of non-operational assets and gains on the sale of businesses, and by further subtracting the tax impact of those expenses, gains, or losses. Management uses adjusted net income and adjusted EPS as measures of operating performance because these measures allow the Company to compare performance consistently over various periods.
EBITDA, EBITDA margin, adjusted EBITDA, adjusted EBITDA margin, incremental EBITDA margin and adjusted incremental EBITDA margin
EBITDA is calculated by adding back to net income depreciation and amortization, interest expense, net, and provision for income taxes. EBITDA margin is calculated as EBITDA divided by revenues. Adjusted EBITDA and adjusted EBITDA margin are calculated by further adding back those expenses resulting from the adjustments to the fair value of contingent consideration resulting from the acquisition of Fox, restructuring costs related to restructuring and workforce reduction plans, and excluding gains and losses on the sale of non-operational assets and gains on the sale of businesses. Management uses EBITDA, EBITDA margin, adjusted EBITDA and adjusted EBITDA margin as measures of operating performance because these measures allow the Company to compare performance consistently over various periods. Incremental EBITDA margin is calculated as the change in EBITDA divided by the change in revenue. Management uses incremental EBITDA margin as a measure of operating performance because this measure allows the Company to compare performance consistently over various periods. Adjusted incremental EBITDA margin is calculated as the change in adjusted EBITDA divided by the change in revenue. Management uses adjusted incremental EBITDA margin as a measure of operating performance because this measure allows the Company to compare performance consistently over various periods.
Free cash flow and free cash flow conversion
Free cash flow is calculated by subtracting capital expenditures from cash provided by operating activities. Management uses free cash flow to demonstrate the Company’s ability to maintain its asset base and generate future cash flows from operations. Free cash flow conversion is calculated as free cash flow divided by net income. Management uses free cash flow conversion to demonstrate how much net income is converted into cash. Management believes that free cash flow is an important financial measure for use in evaluating the Company’s liquidity. Free cash flow should be considered in addition to, rather than as a substitute for, net cash provided by operating activities as a measure of our liquidity. Additionally, the Company’s definition of free cash flow is limited, in that it does not represent residual cash flows available for discretionary expenditures, due to the fact that the measure does not deduct the payments required for debt service and other contractual obligations or payments made for business acquisitions. Therefore, management believes it is important to view free cash flow as a measure that provides supplemental information to our consolidated statements of cash flows.
Adjusted sales, general and administrative ("SG&A")
Adjusted SG&A is calculated by removing the adjustments to the fair value of contingent consideration resulting from the acquisition of Fox. Management uses adjusted SG&A to compare SG&A expenses consistently over various periods.
Leverage ratio
Leverage ratio, a financial valuation measure, is calculated by dividing adjusted net debt by adjusted EBITDAR. Adjusted net debt is calculated by adding operating lease liabilities to total long-term debt less a cash adjustment of 90% of total consolidated cash. Adjusted EBITDAR is calculated by adding back to net income depreciation and amortization, interest expense, net, provision for income taxes, operating lease cost, and stock-based compensation expense. Management uses leverage ratio as an assessment of overall liquidity, financial flexibility, and leverage.
| | | | | | | | | | | | | | | | | | | | | | | | | | |
| | Twelve Months Ended December 31, | | Variance |
| | 2024 | | 2023 | | $ | | % |
| Reconciliation of Revenues to Organic Revenues | | | | | | | | |
| Revenues | | $ | 3,388,708 | | | $ | 3,073,278 | | | 315,430 | | | 10.3 |
| Revenues from acquisitions | | (95,517) | | | — | | | (95,517) | | | 3.1 |
| Revenues of divestitures | | — | | | (20,559) | | | 20,559 | | | (0.7) |
| Organic revenues | | $ | 3,293,191 | | | $ | 3,052,719 | | | 240,472 | | | 7.9 |
| | | | | | | | |
| Reconciliation of Residential Revenues to Organic Residential Revenues | | | | | | | | |
| Residential revenues | | $ | 1,535,104 | | | $ | 1,409,872 | | | 125,232 | | | 8.9 |
| Residential revenues from acquisitions | | (62,799) | | | — | | | (62,799) | | | 4.5 |
| Residential revenues of divestitures | | — | | | (11,913) | | | 11,913 | | | (0.8) |
| Residential organic revenues | | $ | 1,472,305 | | | $ | 1,397,959 | | | 74,346 | | | 5.2 |
| | | | | | | | |
| Reconciliation of Commercial Revenues to Organic Commercial Revenues |
| Commercial revenues | | $ | 1,125,964 | | | $ | 1,024,176 | | | 101,788 | | | 9.9 |
| Commercial revenues from acquisitions | | (24,460) | | | — | | | (24,460) | | | 2.4 |
| Commercial revenues of divestitures | | — | | | (8,646) | | | 8,646 | | | (0.8) |
| Commercial organic revenues | | $ | 1,101,504 | | | $ | 1,015,530 | | | 85,974 | | | 8.3 |
| | | | | | | | |
| Reconciliation of Termite and Ancillary Revenues to Organic Termite and Ancillary Revenues |
| Termite and ancillary revenues | | $ | 688,186 | | | $ | 605,533 | | | 82,653 | | | 13.6 |
| Termite and ancillary revenues from acquisitions | | (8,258) | | | — | | | (8,258) | | | 1.4 |
| Termite and ancillary organic revenues | | $ | 679,928 | | | $ | 605,533 | | | 74,395 | | | 12.2 |
| | | | | | | | | | | | | | | | | | | | | | | | | | |
| | Twelve Months Ended December 31, | | Variance |
| | 2024 | | 2023 | | $ | | % |
| Reconciliation of Operating Income and Operating Income Margin to Adjusted Operating Income and Adjusted Operating Margin |
| Operating income | | $ | 657,224 | | | $ | 583,226 | | | | | |
Fox acquisition-related expenses (1) | | 17,902 | | | 15,795 | | | | | |
Restructuring costs (2) | | — | | | 5,196 | | | | | |
| Adjusted operating income | | $ | 675,126 | | | $ | 604,217 | | | 70,909 | | | 11.7 |
| Revenues | | $ | 3,388,708 | | | $ | 3,073,278 | | | | | |
| Operating income margin | | 19.4 | % | | 19.0 | % | | | | |
| Adjusted operating margin | | 19.9 | % | | 19.7 | % | | | | |
| | | | | | | | |
Reconciliation of Net Income and EPS to Adjusted Net Income and Adjusted EPS (7) |
| Net income | | $ | 466,379 | | | $ | 434,957 | | | | | |
Fox acquisition-related expenses (1) | | 17,902 | | | 15,795 | | | | | |
Restructuring costs (2) | | — | | | 5,196 | | | | | |
Loss (gain) on sale of assets, net (3) | | (683) | | | (6,636) | | | | | |
Gain on sale of businesses (4) | | — | | | (15,450) | | | | | |
Tax impact of adjustments (5) | | (4,408) | | | 280 | | | | | |
| Adjusted net income | | $ | 479,190 | | | $ | 434,142 | | | 45,048 | | | 10.4 |
| EPS - basic and diluted | | $ | 0.96 | | | $ | 0.89 | | | | | |
Fox acquisition-related expenses (1) | | 0.04 | | | 0.03 | | | | | |
Restructuring costs (2) | | — | | | 0.01 | | | | | |
Loss (gain) on sale of assets, net (3) | | — | | | (0.01) | | | | | |
Gain on sale of businesses (4) | | — | | | (0.03) | | | | | |
Tax impact of adjustments (5) | | (0.01) | | | — | | | | | |
Adjusted EPS - basic and diluted (6) | | $ | 0.99 | | | $ | 0.89 | | | 0.10 | | | 11.2 |
| Weighted average shares outstanding - basic | | 484,249 | | | 489,949 | | | | | |
| Weighted average shares outstanding - diluted | | 484,295 | | | 490,130 | | | | | |
| | | | | | | | |
Reconciliation of Net Income to EBITDA, Adjusted EBITDA, EBITDA Margin, Incremental EBITDA Margin, Adjusted EBITDA Margin, and Adjusted Incremental EBITDA Margin (7) |
| Net income | | $ | 466,379 | | | $ | 434,957 | | | | | |
| Depreciation and amortization | | 113,220 | | | 99,752 | | | | | |
| Interest expense, net | | 27,677 | | | 19,055 | | | | | |
| Provision for income taxes | | 163,851 | | | 151,300 | | | | | |
| EBITDA | | 771,127 | | | 705,064 | | | 66,063 | | | 9.4 |
Fox acquisition-related expenses (1) | | $ | 1,049 | | | $ | 3,148 | | | | | |
Restructuring costs (2) | | — | | | 5,196 | | | | | |
Loss (gain) on sale of assets, net (3) | | (683) | | | (6,636) | | | | | |
Gain on sale of businesses (4) | | — | | | (15,450) | | | | | |
| Adjusted EBITDA | | $ | 771,493 | | | $ | 691,322 | | | 80,171 | | | 11.6 |
| Revenues | | $ | 3,388,708 | | | $ | 3,073,278 | | | | | |
| EBITDA margin | | 22.8 | % | | 22.9 | % | | | | |
| Incremental EBITDA margin | | | | | | 20.9 | % | | |
| Adjusted EBITDA margin | | 22.8 | % | | 22.5 | % | | | | |
| Adjusted incremental EBITDA margin | | | | | | 25.4 | % | | |
| | | | | | | | |
| Reconciliation of Net Cash Provided by Operating Activities to Free Cash Flow and Free Cash Flow Conversion |
| Net cash provided by operating activities | | $ | 607,653 | | | 528,366 | | | | | |
| Capital expenditures | | $ | (27,572) | | | $ | (32,465) | | | | | |
| Free cash flow | | $ | 580,081 | | | $ | 495,901 | | | 84,180 | | | 17.0 |
| Free cash flow conversion | | 124.4 | % | | 114.0 | % | | | | |
| | | | | | | | | | | | | | |
| | Twelve Months Ended December 31, |
| | 2024 | | 2023 |
| Reconciliation of SG&A to Adjusted SG&A | | |
| SG&A | | $ | 1,015,067 | | | $ | 915,233 | |
Fox acquisition-related expenses (1) | | 1,049 | | | 3,148 | |
| Adjusted SG&A | | $ | 1,014,018 | | | $ | 912,085 | |
| | | | |
| Revenues | | $ | 3,388,708 | | | $ | 3,073,278 | |
| Adjusted SG&A as a % of revenues | | 29.9 | % | | 29.7 | % |
| | | | | | | | | | | | | | |
| | Twelve Months Ended December 31, |
| | 2024 | | 2023 |
| Reconciliation of Long-term Debt and Net Income to Leverage Ratio | | |
Long-term debt (8) | | $ | 397,000 | | | $ | 493,000 | |
Operating lease liabilities (9) | | 417,218 | | | 325,572 | |
Cash adjustment (10) | | (80,667) | | | (93,443) | |
| Adjusted net debt | | $ | 733,551 | | | $ | 725,129 | |
| | | | |
| Net income | | $ | 466,379 | | | $ | 434,957 | |
| Depreciation and amortization | | 113,220 | | | 99,752 | |
| Interest expense, net | | 27,677 | | | 19,055 | |
| Provision for income taxes | | 163,851 | | | 151,300 | |
Operating lease cost (11) | | 133,420 | | | 110,627 | |
| Stock-based compensation expense | | 29,984 | | | 24,605 | |
| Adjusted EBITDAR | | $ | 934,531 | | | $ | 840,296 | |
| | | | |
| Leverage ratio | | 0.8x | | 0.9x |
(1) Consists of expenses resulting from the amortization of certain intangible assets and adjustments to the fair value of contingent consideration resulting from the acquisition of Fox Pest Control. While we exclude such expenses in this non-GAAP measure, such expenses are expected to recur, the revenue from the acquired company is reflected in this non-GAAP measure and the acquired assets contribute to revenue generation.
(2) Restructuring costs consist of costs primarily related to severance and benefits paid to employees pursuant to restructuring and workforce reduction plans.
(3) Consists of the gain or loss on the sale of non-operational assets.
(4) Represents the gain on the sale of certain non-core businesses.
(5) The tax effect of the adjustments is calculated using the applicable statutory tax rates for the respective periods.
(6) In some cases, the sum of the individual EPS amounts may not equal total non-GAAP EPS calculations due to rounding.
(7) In 2024, we revised the non-GAAP metrics adjusted net income, adjusted EPS, and adjusted EBITDA to exclude gains and losses related to non-operational asset sales. These measures are of operating performance and we believe excluding the gains and losses on non-operational assets allows us to better compare our operating performance consistently over various periods. As a result, these measures may not be comparable to the corresponding measures disclosed in prior years.
(8) As of December 31, 2024 and December 31, 2023, the Company had outstanding borrowings of $397.0 million and $493.0 million, respectively, under the Credit Facility. Borrowings under the Credit Facility are presented under the long-term debt caption of our consolidated balance sheet, net of $1.7 million and $2.2 million in unamortized debt issuance costs as of December 31, 2024 and December 31, 2023, respectively.
(9) Operating lease liabilities are presented under the operating lease liabilities - current and operating lease liabilities, less current portion captions of our consolidated balance sheet.
(10) Represents 90% of cash and cash equivalents per our consolidated balance sheet as of both periods presented.
(11) Operating lease cost excludes short-term lease cost associated with leases that have a duration of 12 months or less.
Liquidity and Capital Resources
Cash and Cash Flow
The Company’s $89.6 million of total cash at December 31, 2024 is held at various banking institutions. Approximately $48.5 million is held in cash by foreign subsidiaries and the remaining $41.1 million is held at domestic banks.
We intend to continue to grow the business in the international markets where we have a presence. As it relates to our unremitted earnings in foreign jurisdictions, we assert that foreign cash earnings in excess of working capital and cash needed for strategic investments and acquisitions are not intended to be indefinitely reinvested offshore.
On February 24, 2023, the Company entered into a revolving credit agreement with, among others, JPMorgan Chase Bank, N.A. (“JPMorgan Chase”), as administrative agent (in such capacity, the “Administrative Agent”), which refinanced its previous credit facility.
The Credit Agreement provides for a $1.0 billion revolving Credit Facility, which may be denominated in U.S. Dollars and other currencies, including Euros, Australian Dollars, Canadian Dollars, New Zealand Dollars, Pounds Sterling and Japanese Yen, subject to a $400 million foreign currency sublimit. Rollins has the ability to expand its borrowing availability under the Credit Agreement in the form of increased revolving commitments or one or more tranches of term loans by up to an additional $750 million, subject to the agreement of the participating lenders and certain other customary conditions. The maturity date of the loans under the Credit Agreement is February 24, 2028. Refer to Note 10, Debt to the accompanying financial statements for further details.
As of December 31, 2024, the Company had outstanding borrowings of $397.0 million under the Credit Facility. The aggregate effective interest rate on the debt outstanding as of December 31, 2024 was 5.5%. As of December 31, 2023, the Company had outstanding borrowings of $493.0 million under the Credit Facility. The aggregate effective interest rate on the debt outstanding as of December 31, 2023 was 6.5%. The Company is in compliance with applicable financial debt covenants as of December 31, 2024.
The Company maintains $72.0 million in letters of credit as of December 31, 2024. These letters of credit are required by the Company’s insurance companies, due to the Company’s high deductible insurance program, to secure various workers’ compensation and casualty insurance contracts coverage and were increased from $71.7 million as of December 31, 2023. The Company believes that it has adequate liquid assets, funding sources and insurance accruals to accommodate potential future insurance claims.
The Company believes its current cash and cash equivalents balances, future cash flows expected to be generated from operating activities, available borrowings under its Credit Facility, access to debt financing based on our creditworthiness, and our newly announced $1 billion commercial paper program authorization, which is backstopped by our Credit Facility, will be sufficient to finance its current operations and obligations, and fund expansion of the business for the foreseeable future.
The following table sets forth a summary of our cash flows from operating, investing and financing activities for the year ended December 31, 2024 and 2023:
| | | | | | | | | | | | | | | | | | | | | | | |
| Year Ended December 31, | | Variance |
| (in thousands) | 2024 | | 2023 | | $ | | % |
| Net cash provided by operating activities | 607,653 | | | 528,366 | | | 79,287 | | | 15.0 |
| Net cash used in investing activities | (176,232) | | | (372,895) | | | (196,663) | | | (52.7) |
| Net cash used in financing activities | (440,708) | | | (149,420) | | | 291,288 | | | 194.9 |
| Effect of exchange rate on cash | (4,908) | | | 2,428 | | | (7,336) | | | N/M |
| Net (decrease) increase in cash and cash equivalents | $ | (14,195) | | | $ | 8,479 | | | (22,674) | | | N/M |
N/M - calculation not meaningful
Cash Provided by Operating Activities
Cash from operating activities is the principal source of cash generation for our businesses. The most significant source of cash in our cash flow from operations is customer-related activities, the largest of which is collecting cash resulting from services sold. The most significant operating use of cash is to pay our suppliers, employees, and tax authorities. The Company’s operating activities generated net cash of $607.7 million and $528.4 million for the twelve months ended December 31, 2024 and 2023, respectively. The $79.3 million increase was driven primarily by strong operating results and the timing of cash receipts and cash payments to vendors, employees, and tax and regulatory authorities.
The US Internal Revenue Service provided disaster relief to all State of Georgia taxpayers due to the impact of Hurricane Helene. Therefore, we did not make an estimated payment for US federal income tax purposes in the fourth quarter of 2024. That estimated tax payment of approximately $32.0 million is now due in the second quarter of 2025.
Cash Used in Investing Activities
The Company’s investing activities used $176.2 million and $372.9 million for the twelve months ended December 31, 2024 and 2023, respectively. Cash paid for acquisitions totaled $157.5 million for the twelve months ended December 31, 2024, as compared to $366.9 million for the twelve months ended December 31, 2023, driven primarily by the acquisition of Fox in 2023. During 2024, the Company invested $27.6 million in capital expenditures, offset by $4.1 million in cash proceeds from the sale of assets, compared with $32.5 million of capital expenditures, $12.5 million in cash proceeds from asset sales, and $15.9 million in cash proceeds from the sale of businesses during 2023. The Company’s investing activities were funded through existing cash balances, operating cash flows, and borrowings under the Credit Facility.
Cash Used in Financing Activities
Cash used in financing activities was $440.7 million and $149.4 million during the twelve months ended December 31, 2024 and 2023, respectively. A total of $298.0 million was paid in cash dividends ($0.62 per share) during the twelve months ended December 31, 2024, compared to $264.3 million in cash dividends paid ($0.54 per share) during the twelve months ended December 31, 2023. The Company made net repayments under its credit facility of $96.0 million during the twelve months ended December 31, 2024, compared to net borrowings of $438.0 million during 2023. During the twelve months ended December 31, 2024, the Company paid $39.8 million of contingent consideration, primarily related to the Fox acquisition, compared to $12.5 million during the twelve months ended December 31, 2023. In addition, during the twelve months ended December 31, 2023, the Company completed the repurchase of 8,724,100 of the shares of common stock from LOR, Inc ("LOR") for $300.0 million in conjunction with the Offering, as defined in our 2023 Annual Report on Form 10-K.
In 2012, the Company’s Board of Directors authorized the purchase of up to 5 million shares of the Company’s common stock. After adjustments for stock splits, the total authorized shares under the share repurchase program is 16.9 million shares. As of December 31, 2024, we have a remaining authorization of 11.4 million shares under the share repurchase program. The Company did not repurchase shares of its common stock on the open market during 2024 or 2023. The Company also withheld $11.6 million and $10.8 million of common stock for the twelve months ended December 31, 2024 and 2023, respectively, in connection with tax withholding obligations of its employees upon vesting of such employees’ equity awards.
In addition, the Form S-3 shelf registration statement on file with the SEC registered $1.5 billion of the Company’s common stock, preferred stock, debt securities, depository shares, warrants, rights, purchase contracts and units for future issuance. The Company may offer and sell some or all of such securities from time to time or through underwriters, brokers or dealers, directly to one or more other purchasers, through a block trade, through agents on a best-efforts basis, through a combination of any of the above methods of sale or through other types of transactions described in the Form S-3. The Company has not sold any such securities as of the date of this Form 10-K. Management is continually evaluating the Company's financial structure and the potential need or desirability of raising additional liquidity through the sale of debt or equity securities.
Litigation
For discussion on the Company’s legal contingencies, see Note 12, Commitments and Contingencies to the accompanying financial statements, and Part I, Item 3, Legal Proceedings.
Contractual Commitments
We have material cash requirements for known contractual obligations and commitments in the form of operating leases and debt obligations. We expect to fund these obligations primarily through cash generated from our operations. Refer to Note 6, Leases and Note 10, Debt to the accompanying financial statements for further details.
Critical Accounting Estimates
The Company views critical accounting estimates to be those that are very important to the portrayal of our financial condition and results of operations, and that require management’s most difficult, complex or subjective judgments. The circumstances that make these judgments difficult or complex relate to the need for management to make estimates about the effect of matters that are inherently uncertain. We believe our critical accounting estimate to be as follows:
Accrued Insurance—The Company retains, up to specified limits, certain risks related to U.S. general liability, workers’ compensation and auto liability. Risks are managed through either high deductible insurance or, for Clark Pest Control only, a non-affiliated group captive insurance member arrangement. The estimated costs of existing and future claims under the retained loss program are accrued based upon historical trends as incidents occur, whether reported or unreported (although actual settlement of the claims may not be made until future periods) and may be subsequently revised based on developments relating to such claims. The group captive is subject to a third-party actuarial study retained by the captive manager, independent from the Company. For the high deductible insurance program, the Company contracts with an independent third-party actuary to provide the Company an estimated liability based upon historical claims information. The actuarial study is a major consideration in establishing the reserve, along with management’s knowledge of changes in business practice and existing claims compared to current balances. Management’s judgment is inherently subjective as a number of factors are outside management’s knowledge and control. Additionally, historical information is not always an accurate indication of future events. The Company continues to be proactive in safety and risk management to develop and maintain ongoing programs to reduce and prevent incidents and claims. Initiatives that have been implemented include required pre-employment screening and ongoing motor vehicle record review for all drivers, post-offer physicals for new employees, pre-hire, random and post incident drug testing, driver training and post-injury nurse triage for work-related injuries. The accruals and reserves we hold are based on estimates that involve a degree of judgment and are inherently variable and could be overestimated or insufficient. If actual claims exceed our estimates, our operating results could be materially affected, and our ability to take timely corrective actions to limit future costs may be limited.
Recent Accounting Guidance and Other Policies and Estimates
See Note 1, Summary of Significant Accounting Policies to the accompanying financial statements (Part II, Item 8 of this Form 10-K) for further discussion.
Item 7A. Quantitative and Qualitative Disclosures about Market Risk
Market Risk
The Company is subject to interest rate risk exposure through borrowings on its $1.0 billion revolving credit facility (the "Credit Facility"). As of December 31, 2024, the Company had outstanding borrowings of $397.0 million under the Credit Facility. See Note 10, Debt to the accompanying financial statements for further details regarding debt. We do not believe that a one percent increase in interest rates, for example, would have a material effect on our results of operations or cash flows. The Company is also exposed to market risks arising from changes in foreign exchange rates. The Company believes that this foreign exchange rate risk will not have a material impact upon the Company’s results of operations going forward.
Item 8. Financial Statements and Supplementary Data
MANAGEMENT’S REPORT ON INTERNAL CONTROL OVER FINANCIAL REPORTING
To the Stockholders of Rollins, Inc.:
The management of Rollins, Inc. and subsidiaries is responsible for establishing and maintaining adequate internal control over financial reporting for the Company. Rollins, Inc. maintains a system of internal accounting controls designed to provide reasonable assurance, at a reasonable cost, that assets are safeguarded against loss or unauthorized use and that the financial records are adequate and can be relied upon to produce financial statements in accordance with accounting principles generally accepted in the United States of America. The internal control system is augmented by written policies and procedures, an internal audit program and the selection and training of qualified personnel. This system includes policies that require adherence to ethical business standards and compliance with all applicable laws and regulations.
Under the supervision and with the participation of our management, including our principal executive officer and principal financial and principal accounting officer, we conducted an evaluation of the effectiveness of the design and operation of internal controls over financial reporting as of December 31, 2024 based on criteria established in the 2013 Internal Control—Integrated Framework issued by the Committee of Sponsoring Organizations of the Treadway Commission. Based on this evaluation, management’s assessment is that Rollins, Inc. maintained effective internal control over financial reporting as of December 31, 2024.
The independent registered public accounting firm, Deloitte & Touche LLP has audited the consolidated financial statements as of and for the year ended December 31, 2024, and has also issued their report on the effectiveness of the Company’s internal control over financial reporting, included in this report on page 38. | | | | | | | | |
| /s/ Jerry E. Gahlhoff, Jr. | | /s/ Kenneth D. Krause |
| Jerry E. Gahlhoff, Jr. | | Kenneth D. Krause |
| | |
| President and Chief Executive Officer | | Executive Vice President and Chief Financial Officer |
| Principal Executive Officer | | Principal Financial Officer |
| | |
Atlanta, Georgia | | |
| February 13, 2025 | | |
REPORT OF INDEPENDENT REGISTERED PUBLIC ACCOUNTING FIRM
To the stockholders and the Board of Directors of Rollins, Inc.
Opinion on Internal Control over Financial Reporting
We have audited the internal control over financial reporting of Rollins, Inc. and subsidiaries (the “Company”) as of December 31, 2024, based on criteria established in Internal Control — Integrated Framework (2013) issued by the Committee of Sponsoring Organizations of the Treadway Commission (COSO). In our opinion, the Company maintained, in all material respects, effective internal control over financial reporting as of December 31, 2024, based on criteria established in Internal Control — Integrated Framework (2013) issued by COSO.
We have also audited, in accordance with the standards of the Public Company Accounting Oversight Board (United States) (PCAOB), the consolidated financial statements as of and for the year ended December 31, 2024, of the Company and our report dated February 13, 2025, expressed an unqualified opinion on those financial statements.
Basis for Opinion
The Company’s management is responsible for maintaining effective internal control over financial reporting and for its assessment of the effectiveness of internal control over financial reporting, included in the accompanying Management’s Report on Internal Control Over Financial Reporting. Our responsibility is to express an opinion on the Company’s internal control over financial reporting based on our audit. We are a public accounting firm registered with the PCAOB and are required to be independent with respect to the Company in accordance with the U.S. federal securities laws and the applicable rules and regulations of the Securities and Exchange Commission and the PCAOB.
We conducted our audit in accordance with the standards of the PCAOB. Those standards require that we plan and perform the audit to obtain reasonable assurance about whether effective internal control over financial reporting was maintained in all material respects. Our audit included obtaining an understanding of internal control over financial reporting, assessing the risk that a material weakness exists, testing and evaluating the design and operating effectiveness of internal control based on the assessed risk, and performing such other procedures as we considered necessary in the circumstances. We believe that our audit provides a reasonable basis for our opinion.
Definition and Limitations of Internal Control over Financial Reporting
A company’s internal control over financial reporting is a process designed to provide reasonable assurance regarding the reliability of financial reporting and the preparation of financial statements for external purposes in accordance with generally accepted accounting principles. A company’s internal control over financial reporting includes those policies and procedures that (1) pertain to the maintenance of records that, in reasonable detail, accurately and fairly reflect the transactions and dispositions of the assets of the company; (2) provide reasonable assurance that transactions are recorded as necessary to permit preparation of financial statements in accordance with generally accepted accounting principles, and that receipts and expenditures of the company are being made only in accordance with authorizations of management and directors of the company; and (3) provide reasonable assurance regarding prevention or timely detection of unauthorized acquisition, use, or disposition of the company’s assets that could have a material effect on the financial statements.
Because of its inherent limitations, internal control over financial reporting may not prevent or detect misstatements. Also, projections of any evaluation of effectiveness to future periods are subject to the risk that controls may become inadequate because of changes in conditions, or that the degree of compliance with the policies or procedures may deteriorate.
/s/ Deloitte & Touche LLP
Atlanta, Georgia
February 13, 2025
REPORT OF INDEPENDENT REGISTERED PUBLIC ACCOUNTING FIRM
To the stockholders and the Board of Directors of Rollins, Inc.
Opinion on the Financial Statements
We have audited the accompanying consolidated statements of financial position of Rollins, Inc. and subsidiaries (the "Company") as of December 31, 2024 and 2023, the related consolidated statements of income, comprehensive income, stockholders' equity, and cash flows, for each of the two years in the period ended December 31, 2024, and the related notes (collectively referred to as the "financial statements"). In our opinion, the financial statements present fairly, in all material respects, the financial position of the Company as of December 31, 2024 and 2023, and the results of its operations and its cash flows for each of the two years in the period ended December 31, 2024, in conformity with accounting principles generally accepted in the United States of America.
We have also audited, in accordance with the standards of the Public Company Accounting Oversight Board (United States) (PCAOB), the Company's internal control over financial reporting as of December 31, 2024, based on criteria established in Internal Control — Integrated Framework (2013) issued by the Committee of Sponsoring Organizations of the Treadway Commission and our report dated February 13, 2025, expressed an unqualified opinion on the Company's internal control over financial reporting.
Basis for Opinion
These financial statements are the responsibility of the Company's management. Our responsibility is to express an opinion on the Company's financial statements based on our audits. We are a public accounting firm registered with the PCAOB and are required to be independent with respect to the Company in accordance with the U.S. federal securities laws and the applicable rules and regulations of the Securities and Exchange Commission and the PCAOB.
We conducted our audits in accordance with the standards of the PCAOB. Those standards require that we plan and perform the audit to obtain reasonable assurance about whether the financial statements are free of material misstatement, whether due to error or fraud. Our audits included performing procedures to assess the risks of material misstatement of the financial statements, whether due to error or fraud, and performing procedures that respond to those risks. Such procedures included examining, on a test basis, evidence regarding the amounts and disclosures in the financial statements. Our audits also included evaluating the accounting principles used and significant estimates made by management, as well as evaluating the overall presentation of the financial statements. We believe that our audits provide a reasonable basis for our opinion.
Critical Audit Matters
Critical audit matters are matters arising from the current-period audit of the financial statements that were communicated or required to be communicated to the audit committee and that (1) relate to accounts or disclosures that are material to the financial statements and (2) involved our especially challenging, subjective, or complex judgments. We determined that there are no critical audit matters.
/s/ Deloitte & Touche LLP
Atlanta, Georgia
February 13, 2025
We have served as the Company's auditor since 2023.
REPORT OF INDEPENDENT REGISTERED PUBLIC ACCOUNTING FIRM
Board of Directors and Stockholders
Rollins, Inc.
Opinion on the Financial Statements
We have audited the accompanying consolidated statement of financial position of Rollins, Inc. (a Delaware corporation) and subsidiaries (the “Company”) as of December 31, 2022 (not presented herein), the related consolidated statements of income, comprehensive income, stockholders’ equity, and cash flows for the year then ended, and the related notes (collectively referred to as the “financial statements”). In our opinion, the financial statements present fairly, in all material respects, the financial position of the Company as of December 31, 2022 (not presented herein), and the results of its operations and its cash flows for the year then ended, in conformity with accounting principles generally accepted in the United States of America.
Basis for Opinion
These financial statements are the responsibility of the Company’s management. Our responsibility is to express an opinion on the Company’s financial statements based on our audit. We are a public accounting firm registered with the Public Company Accounting Oversight Board ("PCAOB") and are required to be independent with respect to the Company in accordance with the U.S. federal securities laws and the applicable rules and regulations of the Securities and Exchange Commission and the PCAOB.
We conducted our audit in accordance with the standards of the PCAOB. Those standards require that we plan and perform the audit to obtain reasonable assurance about whether the financial statements are free of material misstatement, whether due to error or fraud. Our audit included performing procedures to assess the risks of material misstatement of the financial statements, whether due to error or fraud, and performing procedures that respond to those risks. Such procedures included examining, on a test basis, evidence regarding the amounts and disclosures in the financial statements. Our audit also included evaluating the accounting principles used and significant estimates made by management, as well as evaluating the overall presentation of the financial statements. We believe that our audit provides a reasonable basis for our opinion.
/s/ GRANT THORNTON LLP
We served as the Company's auditor from 2004 to 2023.
Atlanta, Georgia
February 16, 2023 (except for Note 19, as to which the date is February 13, 2025)
CONSOLIDATED STATEMENTS OF FINANCIAL POSITION
Rollins, Inc. and Subsidiaries
(in thousands except share information)
| | | | | | | | | | | |
| December 31,
2024 | | December 31,
2023 |
| ASSETS | | | |
| Cash and cash equivalents | $ | 89,630 | | | $ | 103,825 | |
Trade receivables, net of allowance for expected credit losses of $19,770 and $15,797, respectively | 196,081 | | | 178,214 | |
Financed receivables, short-term, net of allowance for expected credit losses of $2,536 and $1,874, respectively | 40,301 | | | 37,025 | |
| Materials and supplies | 39,531 | | | 33,383 | |
| Other current assets | 77,080 | | | 54,192 | |
| Total current assets | 442,623 | | | 406,639 | |
Equipment and property, net of accumulated depreciation of $382,266 and $360,421, respectively | 124,839 | | | 126,661 | |
| Goodwill | 1,161,085 | | | 1,070,310 | |
| Customer contracts, net | 383,092 | | | 386,152 | |
| Trademarks & tradenames, net | 149,895 | | | 151,368 | |
| Other intangible assets, net | 8,602 | | | 8,214 | |
| Operating lease right-of-use assets | 414,474 | | | 323,390 | |
Financed receivables, long-term, net of allowance for expected credit losses of $6,150 and $3,728, respectively | 89,932 | | | 75,909 | |
| Other assets | 45,153 | | | 46,817 | |
| Total assets | $ | 2,819,695 | | | $ | 2,595,460 | |
| LIABILITIES | | | |
| Accounts payable | $ | 49,625 | | | $ | 49,200 | |
| Accrued insurance – current | 54,840 | | | 46,807 | |
| Accrued compensation and related liabilities | 122,869 | | | 114,355 | |
| Unearned revenues | 180,851 | | | 172,380 | |
| Operating lease liabilities – current | 121,319 | | | 92,203 | |
| | | |
| Other current liabilities | 115,658 | | | 101,744 | |
| Total current liabilities | 645,162 | | | 576,689 | |
| Accrued insurance, less current portion | 61,946 | | | 48,060 | |
| Operating lease liabilities, less current portion | 295,899 | | | 233,369 | |
| Long-term debt | 395,310 | | | 490,776 | |
| Other long-term accrued liabilities | 90,785 | | | 90,999 | |
| Total liabilities | 1,489,102 | | | 1,439,893 | |
| Commitments and contingencies (see Note 12) | | | | | |
| STOCKHOLDERS’ EQUITY | | | |
Preferred stock, without par value; 500,000 shares authorized, zero shares issued | — | | | — | |
Common stock, par value $1 per share; 800,000,000 shares authorized, 484,372,303 and 484,080,014 shares issued and outstanding at December 31, 2024 and December 31, 2023, respectively | 484,372 | | | 484,080 | |
| Additional paid-in capital | 155,205 | | | 131,840 | |
| Accumulated other comprehensive loss | (43,634) | | | (26,755) | |
| Retained earnings | 734,650 | | | 566,402 | |
| Total stockholders’ equity | 1,330,593 | | | 1,155,567 | |
| Total liabilities and stockholders’ equity | $ | 2,819,695 | | | $ | 2,595,460 | |
The accompanying notes are an integral part of these consolidated financial statements.
CONSOLIDATED STATEMENTS OF INCOME
Rollins, Inc. and Subsidiaries
(in thousands except per share information)
| | | | | | | | | | | | | | | | | |
| Year Ended December 31, |
| 2024 | | 2023 | | 2022 |
| REVENUES | | | | | |
| Customer services | $ | 3,388,708 | | | $ | 3,073,278 | | | $ | 2,695,823 | |
| COSTS AND EXPENSES | | | | | |
| Cost of services provided (exclusive of depreciation and amortization below) | 1,603,197 | | | 1,469,871 | | | 1,308,399 | |
| Sales, general and administrative | 1,015,067 | | | 915,233 | | | 802,710 | |
| Restructuring costs | — | | | 5,196 | | | — | |
| Depreciation and amortization | 113,220 | | | 99,752 | | | 91,326 | |
| Total operating expenses | 2,731,484 | | | 2,490,052 | | | 2,202,435 | |
| OPERATING INCOME | 657,224 | | | 583,226 | | | 493,388 | |
| Interest expense, net | 27,677 | | | 19,055 | | | 2,638 | |
| Other income, net | (683) | | | (22,086) | | | (8,167) | |
| CONSOLIDATED INCOME BEFORE INCOME TAXES | 630,230 | | | 586,257 | | | 498,917 | |
| PROVISION FOR INCOME TAXES | 163,851 | | | 151,300 | | | 130,318 | |
| NET INCOME | $ | 466,379 | | | $ | 434,957 | | | $ | 368,599 | |
| NET INCOME PER SHARE - BASIC AND DILUTED | $ | 0.96 | | | $ | 0.89 | | | $ | 0.75 | |
| Weighted average shares outstanding – basic | 484,249 | | 489,949 | | 492,300 |
| Weighted average shares outstanding – diluted | 484,295 | | 490,130 | | 492,413 |
| DIVIDENDS PAID PER SHARE | $ | 0.615 | | | $ | 0.540 | | | $ | 0.430 | |
The accompanying notes are an integral part of these consolidated financial statements
CONSOLIDATED STATEMENTS OF COMPREHENSIVE INCOME
Rollins, Inc. and Subsidiaries
(in thousands)
| | | | | | | | | | | | | | | | | |
| Year Ended December 31, |
| 2024 | | 2023 | | 2022 |
| NET INCOME | $ | 466,379 | | | $ | 434,957 | | | $ | 368,599 | |
| Other comprehensive income (loss), net of tax: | | | | | |
| Pension and other postretirement benefit plans | — | | | (215) | | | — | |
| Foreign currency translation adjustments | (17,025) | | | 4,816 | | | (14,215) | |
| Unrealized gain (loss) on available for sale securities | 146 | | | 206 | | | (936) | |
| | | | | |
| Other comprehensive (loss) income, net of tax | (16,879) | | | 4,807 | | | (15,151) | |
| Comprehensive income | $ | 449,500 | | | $ | 439,764 | | | $ | 353,448 | |
The accompanying notes are an integral part of these consolidated financial statements
CONSOLIDATED STATEMENTS OF STOCKHOLDERS’ EQUITY
Rollins, Inc. and Subsidiaries
(in thousands)
| | | | | | | | | | | | | | | | | | | | | | | | | | | | | | | | | | | | | | | |
| Common Stock | | | | Additional
Paid- In
Capital | | Accumulated
Other
Comprehensive
Income (Loss) | | Retained
Earnings | | Total |
| Shares | | Amount | | | | | | | | |
| Balance at December 31, 2021 | 491,911 | | $ | 491,911 | | | | | | | $ | 105,629 | | | $ | (16,411) | | | $ | 530,088 | | | $ | 1,111,217 | |
| Net income | — | | | — | | | | | | | — | | | — | | | 368,599 | | | 368,599 | |
| Other comprehensive income | | | | | | | | | | | | | | | |
| | | | | | | | | | | | | | | |
| Foreign currency translation adjustments | — | | | — | | | | | | | | | (14,215) | | | — | | | (14,215) | |
| Unrealized losses on available for sale securities | — | | | — | | | | | | | — | | | (936) | | | — | | | (936) | |
| Cash dividends | — | | | — | | | | | | | — | | | — | | | (211,618) | | | (211,618) | |
| Stock compensation | 765 | | 765 | | | | | | | 20,450 | | | — | | | — | | | 21,215 | |
| Employee stock buybacks | (228) | | (228) | | | | | | | (6,837) | | | — | | | — | | | (7,065) | |
| Balance at December 31, 2022 | 492,448 | | $ | 492,448 | | | | | | | $ | 119,242 | | | $ | (31,562) | | | $ | 687,069 | | | $ | 1,267,197 | |
| Net income | — | | | — | | | | | | | — | | | — | | | 434,957 | | | 434,957 | |
| Other comprehensive income | | | | | | | | | | | | | | | |
| Pension liability adjustment, net of tax | — | | | — | | | | | | | — | | | (215) | | | — | | | (215) | |
| Foreign currency translation adjustments | — | | | — | | | | | | | — | | | 4,816 | | | — | | | 4,816 | |
| Unrealized gains on available for sale securities | — | | | — | | | | | | | — | | | 206 | | | — | | | 206 | |
| Cash dividends | — | | | — | | | | | | | — | | | — | | | (264,348) | | | (264,348) | |
| Stock compensation | 630 | | 630 | | | | | | | 25,929 | | | — | | | — | | | 26,559 | |
| Employee stock buybacks | (274) | | (274) | | | | | | | (10,532) | | | — | | | — | | | (10,806) | |
| Repurchase and retirement of common stock, including excise tax | (8,724) | | (8,724) | | | | | | | (2,799) | | | — | | | (291,276) | | | (302,799) | |
| Balance at December 31, 2023 | 484,080 | | | $ | 484,080 | | | | | | | $ | 131,840 | | | $ | (26,755) | | | $ | 566,402 | | | $ | 1,155,567 | |
| Net income | — | | | — | | | | | | | — | | | — | | | 466,379 | | | 466,379 | |
| Other comprehensive income | | | | | | | | | | | | | | | |
| | | | | | | | | | | | | | | |
| Foreign currency translation adjustments | — | | | — | | | | | | | — | | | (17,025) | | | — | | | (17,025) | |
| Unrealized gains on available for sale securities | — | | | — | | | | | | | — | | | 146 | | | — | | | 146 | |
| Cash dividends | — | | | — | | | | | | | — | | | — | | | (298,131) | | | (298,131) | |
| Stock compensation | 562 | | 562 | | | | | | | 34,701 | | | — | | | — | | | 35,263 | |
| Employee stock buybacks | (270) | | (270) | | | | | | | (11,336) | | | — | | | — | | | (11,606) | |
| | | | | | | | | | | | | | | |
| Balance at December 31, 2024 | 484,372 | | $ | 484,372 | | | | | | | $ | 155,205 | | | $ | (43,634) | | | $ | 734,650 | | | $ | 1,330,593 | |
The accompanying notes are an integral part of these consolidated financial statements.
CONSOLIDATED STATEMENTS OF CASH FLOWS
Rollins, Inc. and Subsidiaries
(in thousands)
| | | | | | | | | | | | | | | | | |
| 2024 | | 2023 | | 2022 |
| OPERATING ACTIVITIES | | | | | |
| Net income | $ | 466,379 | | | $ | 434,957 | | | $ | 368,599 | |
| Adjustments to reconcile net income to net cash provided by operating activities: | | | | | |
| Depreciation and amortization | 113,220 | | | 99,752 | | | 91,326 | |
| Stock-based compensation expense | 29,984 | | | 24,605 | | | 21,215 | |
| Provision for expected credit losses | 34,026 | | | 26,860 | | | 19,441 | |
| Gain on sale of assets, net | (1,492) | | | (6,635) | | | (8,167) | |
| Gain on sale of businesses, net | — | | | (15,450) | | | — | |
| (Benefit) provision for deferred income taxes | (10,336) | | | (7,644) | | | 1,595 | |
| Changes in operating assets and liabilities: | | | | | |
| Trade accounts receivable | (49,351) | | | (45,874) | | | (34,003) | |
| Financed receivables | (17,299) | | | (15,794) | | | (23,891) | |
| Materials and supplies | (5,874) | | | (4,279) | | | (540) | |
| Other current assets | (24,964) | | | (16,126) | | | 5,836 | |
| Accounts payable and accrued expenses | 47,670 | | | 43,407 | | | 304 | |
| Unearned revenue | 7,470 | | | 6,777 | | | 10,400 | |
| Other long-term assets and liabilities | 18,220 | | | 3,810 | | | 13,815 | |
| Net cash provided by operating activities | 607,653 | | | 528,366 | | | 465,930 | |
| INVESTING ACTIVITIES | | | | | |
| Acquisitions, net of cash acquired | (157,471) | | | (366,854) | | | (119,188) | |
| Capital expenditures | (27,572) | | | (32,465) | | | (30,628) | |
| Proceeds from sale of assets | 4,070 | | | 12,489 | | | 14,597 | |
| Proceeds from sale of businesses | — | | | 15,903 | | | — | |
| Other investing activities, net | 4,741 | | | (1,968) | | | 1,078 | |
| Net cash (used in) investing activities | (176,232) | | | (372,895) | | | (134,141) | |
| FINANCING ACTIVITIES | | | | | |
| Payment of contingent consideration | (39,754) | | | (12,489) | | | (17,334) | |
| Borrowings under term loan | — | | | — | | | 252,000 | |
| Borrowings under revolving commitment | 476,000 | | | 1,070,000 | | | 43,000 | |
| Repayments of term loan | — | | | (55,000) | | | (245,000) | |
| Repayments of revolving commitment | (572,000) | | | (577,000) | | | (150,000) | |
| Payment of dividends | (297,989) | | | (264,348) | | | (211,618) | |
| Cash paid for common stock purchased | (11,606) | | | (315,013) | | | (7,065) | |
| Other financing activities, net | 4,641 | | | 4,430 | | | — | |
| Net cash (used in) financing activities | (440,708) | | | (149,420) | | | (336,017) | |
| Effect of exchange rate changes on cash | (4,908) | | | 2,428 | | | (5,727) | |
| Net (decrease) increase in cash and cash equivalents | (14,195) | | | 8,479 | | | (9,955) | |
| Cash and cash equivalents at beginning of period | 103,825 | | | 95,346 | | | 105,301 | |
| Cash and cash equivalents at end of period | $ | 89,630 | | | $ | 103,825 | | | $ | 95,346 | |
| Supplemental disclosure of cash flow information: | | | | | |
| Cash paid for interest | $ | 32,559 | | | $ | 19,239 | | | $ | 4,162 | |
| Cash paid for income taxes, net | $ | 145,638 | | | $ | 159,154 | | | $ | 119,573 | |
| Non-cash additions to operating lease right-of-use assets | $ | 210,282 | | | $ | 146,558 | | | $ | 122,149 | |
The accompanying notes are an integral part of these consolidated financial statements
NOTES TO CONSOLIDATED FINANCIAL STATEMENTS
Years ended December 31, 2024 2023, and 2022, Rollins, Inc. and Subsidiaries
1. SUMMARY OF SIGNIFICANT ACCOUNTING POLICIES
Business Description—Rollins, Inc. (“Rollins,” “we,” “us,” “our,” or the “Company”), is an international services company headquartered in Atlanta, Georgia that provides pest and termite control services to both residential and commercial customers through its wholly-owned subsidiaries and independent franchises in the United States ("U.S."), Canada, Australia, Europe, and Asia with international franchises in Canada, Central and South America, the Caribbean, Europe, the Middle East, Asia, Africa, and Australia.
Principles of Consolidation—The Company’s Consolidated Financial Statements include the accounts of Rollins, Inc. and the Company’s wholly-owned subsidiaries and have been prepared in accordance with accounting principles generally accepted in the U.S. (“GAAP”). The Company does not consolidate the financial statements of any company in which it does not have a controlling financial interest. The Company is not the primary beneficiary of, nor does it have a controlling financial interest in, any variable interest entity. Accordingly, the Company has not consolidated any variable interest entity. All material intercompany accounts and transactions have been eliminated.
Segment Reporting—During 2024, we reorganized our operational leadership and management reporting structure. As a result of the reorganization, we reevaluated our segment reporting and determined that we have three operating segments and three goodwill reporting units. We continue to operate under one reportable segment which contains our residential, commercial, and termite service offerings.
Subsequent Events—The Company evaluates its financial statements through the date the financial statements are issued. Refer to Note 20, Subsequent Events for further details.
Use of Estimates—The preparation of financial statements in conformity with GAAP requires management to make estimates and assumptions that affect the reported amounts of assets and liabilities, revenue and expenses and certain financial statement disclosures. Estimates and assumptions are used for, but not limited to, accrued insurance, revenue recognition, right-of-use ("ROU") asset and liability valuations, accounts and financed receivable reserves, inventory (materials and supplies) valuation, employee benefit plans, income tax contingency accruals and valuation allowances, contingency accruals, goodwill and other intangible asset valuations. Although these estimates are based on management's knowledge of current events and actions it may undertake in the future, actual results may ultimately differ from these estimates and assumptions. In the opinion of management, all adjustments necessary for a fair presentation of the Company’s financial results for the year have been made. These adjustments are of a normal recurring nature. The results of operations for the year ended December 31, 2024 are not necessarily indicative of results for future years.
Revenue Recognition—The Company’s revenue recognition policy is to recognize revenue upon transfer of control of promised products and services to customers in an amount that reflects the consideration we expect to receive in exchange for those products or services. We enter into contracts that can include various combinations of products and services, each of which are distinct and accounted for as separate performance obligations. Revenue is recognized net of allowances for returns and any taxes collected from customers, which are subsequently remitted to governmental authorities.
Nature of Goods and Services and Performance Obligations
The Company contracts with its customers to provide the following goods and services, each of which is a distinct performance obligation:
Pest control services - Rollins provides pest control services to protect residential and commercial properties from common pests, including rodents and insects. Pest control generally consists of assessing a customer’s property for conditions that invite pests, addressing current infestations, and stopping the life cycle to prevent future invaders. Revenue from pest control services is recognized as services are rendered.
The Company’s revenue recognition policies are designed to recognize revenues upon satisfaction of the performance obligation at the time services are performed. Residential and commercial pest control services are primarily recurring in nature on a monthly, bi-monthly or quarterly basis, while certain types of commercial customers may receive multiple treatments within a given month. In general, pest control customers sign an initial one-year contract, and revenues are
recognized at the time services are performed. The Company defers recognition of advance payments and recognizes the revenue as the services are rendered. The Company classifies discounts related to the advance payments as a reduction in revenues.
Termite control services - Rollins provides a variety of termite protection services. Termite protection programs include liquid treatments, wet and dry foam applications, termite baiting and wood treatments. Revenue from initial termite treatment services is recognized as services are provided.
Maintenance/monitoring/inspection - In connection with the initial service offerings, Rollins provides recurring maintenance, monitoring or inspection services to help protect customers’ property from any future sign of termite activities after the original treatment. This recurring service is a service-type warranty under ASC 606, “Revenue from Contracts with Customers,” as it is routinely sold and purchased separately from the initial treatment services and is typically purchased or renewed annually.
Termite baiting revenues are recognized based on the transfer of control of the individual units of accounting. At the inception of a new baiting services contract, upon quality control review of the installation, the Company recognizes revenue for the installation of the monitoring stations, initial directed liquid termiticide treatment and servicing of the monitoring stations. A portion of the contract amount is deferred for the undelivered monitoring performance obligation. This portion is recognized as income on a straight-line basis over the remaining contract term, which results in recognition of revenue that depicts the Company’s performance in transferring control of the service. The allocation of the transaction price to the two deliverables is based on the relative stand-alone selling price. There are no contingencies related to the delivery of additional items or meeting other specified performance conditions. Baiting renewal revenue is deferred and recognized over the annual contract period on a straight-line basis that depicts the Company’s performance in transferring control of the service.
Revenue received for conventional termite renewals is deferred and recognized on a straight-line basis over the remaining contract term that depicts the Company’s performance in transferring control of the service, and the cost of reinspections, reapplications and repairs and associated labor and chemicals are expensed as incurred. For outstanding claims, an estimate is made of the costs to be incurred (including legal costs) based upon current factors and historical information. The performance of reinspections tends to be close to the contract renewal date, and while reapplications and repairs involve an insubstantial number of the contracts, these costs are incurred over the contract term. As the revenue is being deferred, the future cost of reinspections, reapplications and repairs and associated labor and chemicals applicable to the deferred revenue are expensed as incurred. The Company accrues for known claims. The costs of providing termite services upon renewal are compared to the expected revenue to be received and a provision is made for any expected losses.
Miscellaneous services - In certain agreements with customers, Rollins may offer other miscellaneous services, including restroom cleaning (eliminating foul odors, grease and grime which could attract pests) and training (seminars covering good manufacturing practices and product stewardship). Revenue from miscellaneous services is recognized when services are provided.
Contract Balances
Timing of revenue recognition may differ from the timing of invoicing to customers. We record unearned revenue when revenue is recognized subsequent to billing. Unearned revenue mainly relates to the Company’s termite baiting offering, conventional renewals, and year-in-advance pest control services for which we have been paid in advance and earn the revenue when we transfer control of the product or perform the service. For multi-year agreements, we generally invoice customers annually at the beginning of each annual coverage period. Refer to Note 3, Revenue for further information, including changes in unearned revenue for the year.
The Company extends terms to certain customers on higher dollar termite and ancillary work, as well as to certain franchisees for initial funding on the sale of franchises. These financed receivables are segregated from our trade receivables.
Payment terms and conditions vary by contract type, although terms generally include a requirement of payment within 30 to 60 days. In instances where the timing of revenue recognition differs from the timing of invoicing, we have determined our contracts generally do not include a significant financing component. The primary purpose of our invoicing terms is to provide customers with simplified and predictable ways of purchasing our products and services, not to receive financing from our customers or to provide customers with financing.
Incremental Costs of Obtaining a Contract with a Customer
Incremental costs of obtaining a contract include only those costs that we incur to obtain a contract that we would not have incurred if the contract had not been obtained, primarily sales commissions. These costs are considered incremental costs to obtain a contract and are, therefore, recognized as an asset and amortized to expense over the life of the contract to the extent such costs are expected to be recovered. Capitalized costs of obtaining a contract are recorded within other current assets and other assets on our consolidated statements of financial position. Amortization of capitalized costs is recorded within sales, general and administrative expense on our consolidated statements of income.
Practical Expedients and Exemptions
In certain cases, we expense sales commissions when incurred because the amortization period would have been one year or less. These costs are recorded within selling, general and administrative expenses in our consolidated statements of income.
We do not disclose the value of unsatisfied performance obligations for (i) contracts with an original expected length of one year or less and (ii) contracts for which we recognize revenue at the amount to which we have the right to invoice for services performed.
Allowance for Expected Credit Losses—The Company maintains an allowance for expected credit losses based on the expected collectability of accounts receivable. Management uses historical collection results as well as accounts receivable aging in order to determine the expected collectability of accounts receivable. Substantially all of the Company’s receivables are due from pest control and termite services in the United States and select international locations. The Company’s allowance for expected credit losses is determined using a combination of factors. The Company’s established credit evaluation procedures seek to minimize the amount of business we conduct with higher risk customers. Provisions for expected credit losses are recorded in selling, general and administrative expenses. Accounts are written off against the allowance for expected credit losses when the Company determines that amounts are uncollectible, and recoveries of amounts previously written off are recorded when collected. Significant recoveries will generally reduce the required provision in the period of recovery. Therefore, the provision for expected credit losses can fluctuate from period to period. We record specific provisions when we become aware of a customer’s inability to meet its financial obligations to us, such as in the case of bankruptcy filings or deterioration in the customer’s operating results or financial position. If circumstances related to customers change, our estimates of the realizability of receivables would be further adjusted, either upward or downward.
Advertising—Advertising costs are charged to sales, general and administrative expense during the period in which they are incurred.
| | | | | | | | | | | | | | | | | |
| Years ended December 31, | 2024 | | 2023 | | 2022 |
| (in thousands) | | | | | |
| Advertising | $ | 119,573 | | | $ | 115,987 | | | $ | 102,959 | |
Cash and Cash Equivalents—The Company considers all investments with an original maturity of three months or less when purchased to be cash equivalents.
The Company’s $89.6 million of total cash at December 31, 2024 is held at various banking institutions. Approximately $48.5 million is held in cash by foreign subsidiaries and the remaining $41.1 million is held at domestic banks. The Company has not incurred any losses in these accounts.
| | | | | | | | | | | |
| At December 31, | 2024 | | 2023 |
| (in thousands) | | | |
| Cash held in foreign bank accounts | $ | 48,504 | | | $ | 52,141 | |
Rollins maintains adequate liquidity and capital resources, without regard to its foreign deposits, that are directed to finance domestic operations and obligations and to fund expansion of its business for the foreseeable future.
Marketable Securities—From time to time, the Company maintains investments held by various financial institutions. The Company’s investment policy does not allow investment in any securities rated less than “investment grade” by national rating services.
Management determines the appropriate classification of debt securities at the time of purchase and re-evaluates such designations as of each balance sheet date. Debt securities are classified as available-for-sale because the Company does not have the intent to hold the securities to maturity. Available-for-sale securities are stated at their fair values, with the unrealized gains and losses reported in other comprehensive income.
The Company had no other marketable securities other than those held in the defined benefit pension plan and the non-qualified deferred compensation plan at December 31, 2024 and 2023. See Note 11 for further details.
Materials and Supplies—Materials and supplies are stated at the lower of cost or net realizable value. Cost is determined on the first-in, first-out method.
Other Current Assets—Other current assets include prepaid expenses, the current portion of capitalized costs to obtain a contract, divestiture receivables and an international bond investment.
Cloud Computing Costs—The Company capitalizes software license fees and implementation costs associated with cloud hosting arrangements that are service contracts. These amounts are included in other current assets and other assets in the accompanying balance sheets. Amortization of the software license fees is calculated using the straight-line method over the term of the service contract. Amortization of the implementation costs is calculated using the straight-line method based on the term of the service contract or based on the expected utilization of the asset and commences once the module or component is ready for its intended use.
Income Taxes—The Company provides for income taxes based on FASB ASC topic 740 “Income Taxes,” which requires recognition of deferred tax liabilities and assets for the expected future tax consequences of events that have been included in the consolidated financial statements or tax returns. The Company provides an allowance for deferred tax assets when it determines that it is more likely than not that the deferred tax assets will not be utilized. The Company establishes additional provisions for income taxes when, despite the belief that tax positions are fully supportable, there remain certain positions that do not meet the minimum probability threshold. The Company’s policy is to record interest and penalties related to income tax matters in income tax expense.
Equipment and Property—Equipment and property are stated at cost, net of accumulated depreciation, and are depreciated on a straight-line basis over the estimated useful lives of the related assets. Depreciation expense is computed using the following asset lives: buildings, 10 to 40 years; and furniture, fixtures and operating equipment, 2 to 10 years. Expenditures for additions, major renewals and betterments are capitalized and expenditures for maintenance and repairs are expensed as incurred. The cost of assets retired or otherwise disposed of and the related accumulated depreciation and amortization are eliminated from the accounts in the year of disposal with the resulting gain or loss credited or charged to other income, net on our consolidated statements of income.
Certain internal-use software and systems development costs are capitalized. Accordingly, the specific identified costs incurred to develop and obtain software, which is intended for internal use, are not capitalized until the software is put into use. Management, with the relevant authority, authorizes and commits to funding a software project and it is probable that the project will be completed and the software will be used to perform the function intended. Costs incurred during a software development’s discovery phase and post-integration stage, are expensed as incurred. Application development activities that are eligible for capitalization include software design and configuration, development of interfaces, coding, testing and installation. Capitalized internal-use software and systems costs are subsequently amortized on a straight-line basis over a three to seven years period after project completion and when the related software or system is ready for intended use.
Impairment of Long-Lived Assets—In accordance with the FASB ASC Topic 360, “Property, Plant and Equipment,” the Company’s long-lived assets, such as property and equipment and intangible assets with definite lives are reviewed for impairment whenever events or changes in circumstances indicate that the carrying amount of these assets may not be recoverable. Recoverability of assets to be held and used is measured by a comparison of the carrying amount of an asset to estimated undiscounted future cash flows expected to be generated by the asset. If the carrying amount of an asset exceeds its estimated undiscounted future cash flows, an impairment charge is recognized in the amount by which the carrying amount of the asset exceeds the fair value of the asset. We periodically evaluate the appropriateness of remaining
depreciable lives assigned to long-lived assets, including customer contracts and assets that may be subject to a management plan for disposition.
Goodwill and Other Intangible Assets—In accordance with the FASB ASC Topic 350, “Intangibles - Goodwill and other,” the Company classifies intangible assets into three categories: (1) intangible assets with definite lives subject to amortization; (2) intangible assets with indefinite lives not subject to amortization; and (3) goodwill. The Company does not amortize intangible assets with indefinite lives or goodwill. Goodwill and other intangible assets with indefinite useful lives are tested for impairment annually or more frequently if events or circumstances indicate the assets might be impaired. Such conditions may include an economic downturn or a change in the assessment of future operations. The Company performs impairment tests of goodwill at the reporting unit level annually on October 1st. Such impairment tests for goodwill include comparing the fair value of the appropriate reporting unit with its carrying value. If the fair value of the reporting unit is below the carrying value, the Company recognizes a goodwill impairment charge for the amount by which the carrying value exceeds the reporting unit’s fair value. The Company performs impairment tests for indefinite-lived intangible assets by comparing the fair value of each indefinite-lived intangible asset to its carrying value. The Company recognizes an impairment charge if the asset’s carrying value exceeds its estimated fair value.
The Company completed its most recent annual impairment analysis as of October 1, 2024. Based upon the results of these analyses, the Company has concluded that no impairment of its goodwill or intangible assets with indefinite lives was indicated. There were no goodwill or indefinite-lived intangible asset impairments recognized in the years ended December 31, 2024, 2023, and 2022.
Other Assets—Other assets is mostly comprised of deferred compensation assets, the non-current portion of capitalized costs to obtain a contract, and an international bond investment.
Accrued Insurance—The Company retains, up to specified limits, certain risks related to general liability, workers’ compensation and auto liability. Risks are managed through either high deductible insurance or, for Clark Pest Control only, a non-affiliated group captive insurance member arrangement. The estimated costs of existing and future claims under the retained loss program are accrued based upon historical trends as incidents occur, whether reported or unreported (although actual settlement of the claims may not be made until future periods) and may be subsequently revised based on developments relating to such claims. The group captive is subject to a third-party actuary retained by the captive manager, independent from the Company. For the high deductible insurance program, the Company contracts with an independent third-party actuary to provide the Company an estimated liability based upon historical claims information. The actuarial study is a major consideration in establishing the reserve, along with management’s knowledge of changes in business practice and existing claims compared to current balances. Management’s judgment is inherently subjective as a number of factors are outside management’s knowledge and control. Additionally, historical information is not always an accurate indication of future events. The Company continues to be proactive in safety and risk management to develop and maintain ongoing programs to reduce and prevent incidents and claims. Initiatives that have been implemented include required pre-employment screening and ongoing motor vehicle record review for all drivers, post-offer physicals for new employees, pre-hire, random and post incident drug testing, driver training and post-injury nurse triage for work-related injuries. The accruals and reserves we hold are based on estimates that involve a degree of judgment and are inherently variable and could be overestimated or insufficient. If actual claims exceed our estimates, our operating results could be materially affected, and our ability to take timely corrective actions to limit future costs may be limited.
Accrual for Termite Contracts—The Company maintains an accrual for termite claims representing the estimated costs of reapplications, repairs and associated labor and chemicals, settlements, awards and other costs relative to termite control services. Factors that may impact future costs include termiticide life expectancy and government regulation. An accrual for termite contracts is included in other current liabilities and long-term accrued liabilities on the Company’s consolidated statements of financial position.
Other Current Liabilities—Other current liabilities are mostly comprised of the current portion of acquisition holdback and earnout liabilities (see Note 9), contingency accruals, deferred compensation liabilities (see Note 11) and taxes payable.
Other Long-term Accrued Liabilities—Other long-term accrued liabilities include long-term balances for deferred compensation, acquisition holdback and earnout liabilities, deferred tax liabilities, contingency accruals, and the long-term portion of unearned revenue.
Contingency Accruals—The Company is a party to legal proceedings with respect to matters in the ordinary course of business. In accordance with the FASB ASC Topic 450 “Contingencies,” management estimates and accrues for its liability and costs associated with the pending and threatened legal and regulatory proceedings. Estimates and accruals are determined in consultation with outside counsel. Because it is not possible to accurately predict the ultimate result of the proceedings, judgments concerning accruals for liabilities and costs associated with litigation are inherently uncertain and actual liability may vary from amounts estimated or accrued. However, in the opinion of management, the outcome of the proceedings will not have a material adverse impact on the Company’s financial condition or results of operations. Contingency accruals are included in other current liabilities and long-term accrued liabilities on the Company’s consolidated statements of financial position.
Earnings Per Share—the FASB ASC Topic 260-10 “Earnings Per Share-Overall,” requires a basic earnings per share and diluted earnings per share presentation. Further, all outstanding unvested share-based payment awards that contain non-forfeitable rights to dividends or dividend equivalents, whether paid or unpaid, are considered participating securities and an entity is required to include participating securities in its calculation of basic earnings per share.
The Company calculates basic and diluted earnings per share using the two-class method. Under the two-class method, net earnings are allocated to each class of common stock and participating security as if all of the net earnings for the period had been distributed. The Company's participating securities consist of share-based payment awards that contain a nonforfeitable right to receive dividends and, therefore, are considered to participate in undistributed earnings with common shareholders. See Note 13 for further information on restricted stock granted to employees. See Note 18 for the calculation of basic and diluted earnings per share under the two-class method.
Translation of Foreign Currencies—Assets and liabilities reported in functional currencies other than U.S. dollars are translated into U.S. dollars at the year-end rate of exchange. Revenues and expenses are translated at the weighted average exchange rates for the year. The resulting translation adjustments are charged or credited to other comprehensive income. Gains or losses from foreign currency transactions, such as those resulting from the settlement of receivables or payables, denominated in foreign currency are included in the earnings of the current period.
Stock-Based Compensation—The Company accounts for its stock-based compensation in accordance with the FASB ASC Topic 718 “Compensation – Stock Compensation.” Time-lapsed restricted stock awards and restricted stock units ("restricted shares") have been issued to officers and other management employees under the Company’s Employee Stock Incentive Plan. In addition, in 2023 and 2024, performance share units (“PSUs”) were granted to the Company’s executive officers. The PSUs will vest and convert to shares of common stock at the end of a three-year performance period upon the Company’s successful achievement of certain financial and market performance goals. The Company issues new shares from its authorized but unissued share pool.
Restricted shares and PSUs provide for the issuance of a share of the Company’s common stock at no cost to the holder and generally vest after a certain stipulated number of years from the grant date, depending on the terms of the issue. During these years, certain restricted shares award grantees receive all dividends declared and retain voting rights for the granted shares. The agreements under which the restricted shares are issued provide that shares awarded may not be sold or otherwise transferred until restrictions established under the plans have lapsed.
The fair value of each restricted share and PSUs with Company-specific performance criteria is equal to the market value of a share of the Company's common stock on the grant date. For PSUs that are granted with a total shareholder return ("TSR") component, management estimates the fair value using a Monte Carlo simulation valuation model, as these awards are subject to a market condition. The fair value of these awards is recognized as compensation expense, net of estimated forfeitures, on a straight-line basis over the vesting period.
Comprehensive Income (Loss)—Other Comprehensive Income (Loss) results from foreign currency translations, minimum pension liability adjustments, and unrealized gains and losses on available for sale securities.
Franchising Program—The Company has franchise programs through Orkin, Critter Control and its Australian subsidiaries. We had a total of 140 domestic franchise agreements as of December 31, 2024. International franchise agreements totaled 87 as of December 31, 2024. Transactions with our franchises involve sales of territories and customer contracts to establish new franchises and the payment of initial franchise fees and royalties by franchisees. The territories, customer contracts and initial franchise fees are typically paid for by a combination of cash and notes.
Combined domestic and international revenues from Orkin, Critter Control and Australia franchises were $16.9 million, $16.5 million and $15.6 million for the years ended December 31, 2024, 2023 and 2022, respectively. Total franchising revenues were less than 1.0% of the Company’s annual revenues for each of the three years.
Right to access intellectual property (Franchise)—The right to access Orkin’s, Critter Control’s and our Australia franchisors’ intellectual property is an essential part of our franchise agreements. These agreements provide the franchisee a license to use the brand name and trademark when advertising and selling services to end customers in their normal course of business. Orkin and Critter Control franchise agreements contain a clause allowing the respective franchisor to purchase certain assets of the franchisee at the conclusion of their franchise agreement or upon termination. This is only an option for the franchisor to re-purchase the assets selected by the franchisor and is not a performance obligation or a form of consideration.
Recent Accounting Guidance
Recently adopted accounting standards
In 2024, the Company adopted FASB ASU 2023-07, "Segment Reporting (Topic 280): Improvements to Reportable Segment Disclosures (“ASU 2023-07”), which is intended to improve reportable segment disclosure requirements, primarily through additional and more detailed information about a reportable segment's expenses. Refer to Note 19. Segment and Geographical Information for further details.
Accounting standards issued but not yet adopted
In October 2023, the FASB issued ASU 2023-06, “Disclosure Improvements: Codification Amendments in Response to the SEC’s Disclosure Update and Simplification Initiative,” to amend certain disclosure and presentation requirements for a variety of topics within the ASC. These amendments align the requirements in the Accounting Standards Codification ("ASC") to the removal of certain disclosure requirements set out in Regulation S-X and Regulation S-K, announced by the SEC. The effective date for each amended topic in the ASC is either the date on which the SEC’s removal of the related disclosure requirement from Regulation S-X or Regulation S-K becomes effective, or on June 30, 2027, if the SEC has not removed the requirements by that date. Early adoption is prohibited. The Company does not expect that the application of this standard will have a material impact on its consolidated financial statements and disclosures.
In December 2023, the FASB issued ASU 2023-09, “Income Taxes (Topic 740): Improvements to Income Tax Disclosures” (“ASU 2023-09”), which is intended to enhance the transparency and decision usefulness of income tax disclosures. This amendment modifies the rules on income tax disclosures to require entities to disclose (1) specific categories in the rate reconciliation and additional information for reconciling items that meet a quantitative threshold, (2) the amount of income taxes paid (net of refunds received) (disaggregated by federal, state, and foreign taxes) as well as individual jurisdictions in which income taxes paid is equal to or greater than 5 percent of total income taxes paid net of refunds, (3) the income or loss from continuing operations before income tax expense or benefit (disaggregated between domestic and foreign) and (4) income tax expense or benefit from continuing operations (disaggregated by federal, state and foreign). The guidance is effective for annual periods beginning after December 15, 2024, with early adoption permitted for annual financial statements that have not yet been issued or made available for issuance. ASU 2023-09 should be applied on a prospective basis, while retrospective application is permitted. The Company is currently evaluating the potential impact of adopting this new ASU on its disclosures.
In November 2024, the FASB issued ASU 2024-03, "Disaggregation of Income Statement Expenses (DISE)", which requires additional disclosure of the nature of expenses included in the income statement in response to longstanding requests from investors for more information about an entity’s expenses. The new standard requires disclosures about specific types of expenses included in the expense captions presented on the face of the income statement as well as disclosures about selling expenses. The guidance will be effective for annual reporting periods beginning after December 15, 2026 and interim reporting periods beginning after December 15, 2027. The requirements will be applied prospectively with the option for retrospective application. Early adoption is permitted. The Company is currently evaluating the impact that the adoption of this ASU will have on its consolidated financial statements and related disclosures.
2. ACQUISITIONS
2024 Acquisitions
The Company made 44 acquisitions during 2024. The aggregate preliminary values of major classes of assets acquired and liabilities assumed recorded at the dates of acquisition, as adjusted during the valuation period, are included in the reconciliation of the total preliminary consideration as follows (in thousands):
| | | | | |
| 2024 |
| Cash | $ | 1,671 | |
| Accounts receivable, net | 4,954 | |
| Materials and supplies | 1,053 | |
| Other current assets | 446 | |
| Equipment and property | 8,251 | |
| Goodwill | 97,914 | |
| Customer contracts | 72,509 | |
| Trademarks & tradenames | 1,566 | |
| Other intangible assets | 2,609 | |
| Current liabilities | (2,167) | |
| Unearned revenue | (1,289) | |
| Other assets and liabilities, net | (4,764) | |
| Assets acquired and liabilities assumed | $ | 182,753 | |
Included in the total consideration of $182.8 million are acquisition holdback liabilities and other contingent consideration of $20.9 million, as well as $3.1 million of notes payable issued as consideration.
The Company also made payments of $0.4 million related to prior year acquisitions during the year ended December 31, 2024.
Goodwill from these acquisitions represents the excess of the purchase price over the fair value of net assets of businesses acquired. The factors contributing to the amount of goodwill are based on strategic and synergistic benefits that are expected to be realized. A majority of the recognized goodwill is expected to be deductible for tax purposes. Valuations of certain assets and liabilities, including intangible assets and goodwill, as of the acquisition date have not been finalized at this time and are provisional.
Fox Pest Control Acquisition
On April 1, 2023, the Company acquired 100% of FPC Holdings, LLC (“Fox Pest Control”, or "Fox"). As part of funding the Fox Pest Control acquisition, on April 3, 2023, the Company borrowed incremental amounts under the Credit Agreement of $305.0 million. The proceeds were used to pay cash consideration at closing.
The Fox acquisition was accounted for as a business combination. The valuation of the Fox acquisition was performed by a third-party valuation specialist under our management’s supervision. The values of identified assets acquired and liabilities assumed were finalized as of March 31, 2024 and are summarized in the table below (in thousands):
| | | | | |
| Fox Pest Control |
| Cash | $ | 4,560 | |
| Accounts receivable | 1,542 | |
| Materials and supplies | 431 | |
| Operating lease right-of-use assets | 8,689 | |
| Other current assets | 487 | |
| |
| Goodwill | 188,176 | |
| Customer contracts | 118,000 | |
| Trademarks & tradenames | 38,000 | |
| Current liabilities | (5,538) | |
| Unearned revenue | (6,144) | |
| Operating lease liabilities | (8,689) | |
| Assets acquired and liabilities assumed | $ | 339,514 | |
The Company purchased Fox for $339.5 million. Included in the total consideration were cash payments of $302.8 million made upon closing, contingent consideration valued at $28.0 million that were based on Fox's financial performance in the twelve months following acquisition, and holdback liabilities valued at $8.7 million held by the Company to settle indemnity claims and working capital adjustments. The fair value of the contingent consideration was estimated using a Monte Carlo simulation. During the year ended December 31, 2024, we recognized a charge of $1.0 million related to adjustments to the fair value of contingent consideration resulting from the acquisition of Fox. This charge is reported within sales, general and administrative expenses in our consolidated statement of income.
Acquired customer contracts are estimated to have a remaining useful life of 7 years. The acquired trademarks and tradenames are expected to have an indefinite useful life. See Note 8, Customer Contracts, Tradenames and Trademarks, and Other Intangible Assets for further details.
Goodwill from this acquisition represents the excess of the purchase price over the fair value of net assets of the business acquired. The factors contributing to the amount of goodwill were based on strategic and synergistic benefits that are expected to be realized. The recognized goodwill is deductible for tax purposes.
Pro Forma Financial Information
The following table presents unaudited consolidated pro forma information as if the acquisition of Fox had occurred on January 1, 2022. The information presented below is for illustrative purposes only and is not necessarily indicative of results that would have been achieved if the acquisition had actually occurred as of the beginning of such years or results which may be achieved in the future.
| | | | | | | | | | | |
| Year Ended December 31, |
| (in thousands) | 2023 | | 2022 |
| Revenues | $ | 3,102,186 | | | $ | 2,817,629 | |
| Net income | 424,735 | | | 358,930 | |
The pro forma financial information above adjusts for the effects of material business combination items, including the alignment of accounting policies, the effect of fair value adjustments including the amortization of acquired intangible assets, interest expense related to the incremental borrowings under the Credit Agreement, and income tax effects as if Fox had been part of Rollins since January 1, 2022.
Other 2023 Acquisitions
The Company made 23 other acquisitions during 2023. The aggregate values of major classes of assets acquired and liabilities assumed recorded at the dates of acquisition, as adjusted during the valuation period, are included in the reconciliation of the total consideration as follows (in thousands):
| | | | | |
| 2023 |
| Cash | $ | 531 | |
| Accounts receivable, net | 1,190 | |
| Materials and supplies | 592 | |
| Other current assets | 198 | |
| Equipment and property | 5,002 | |
| Goodwill | 37,319 | |
| Customer contracts | 31,996 | |
| Trademarks & tradenames | 1,457 | |
| Other intangible assets | 2,357 | |
| Current liabilities | (1,462) | |
| Other assets and liabilities, net | (2,472) | |
| Assets acquired and liabilities assumed | $ | 76,708 | |
Included in the total consideration of $76.7 million were acquisition holdback liabilities of $7.8 million.
Goodwill from these acquisitions represents the excess of the purchase price over the fair value of net assets of businesses acquired. The factors contributing to the amount of goodwill were based on strategic and synergistic benefits that are expected to be realized. The recognized goodwill is deductible for tax purposes.
3. REVENUE
Sales and usage-based taxes are excluded from revenues. No sales to an individual customer or in a country other than the United States accounted for 10% or more of the sales for the periods listed in the following tables. Revenue, classified by the major geographic areas in which our customers are located, was as follows:
| | | | | | | | | | | | | | | | | |
| 2024 | | 2023 | | 2022 |
| (in thousands) | | | | | |
| United States | $ | 3,143,372 | | | $ | 2,853,321 | | | $ | 2,498,363 | |
| Other countries | 245,336 | | | 219,957 | | | 197,460 | |
| Total Revenues | $ | 3,388,708 | | | $ | 3,073,278 | | | $ | 2,695,823 | |
Revenue from external customers, classified by significant product and service offerings, was as follows:
| | | | | | | | | | | | | | | | | |
| (in thousands) | 2024 | | 2023 | | 2022 |
| Residential revenue | $ | 1,535,104 | | | $ | 1,409,872 | | | $ | 1,207,089 | |
| Commercial revenue | 1,125,964 | | | 1,024,176 | | | 920,625 | |
| Termite completions, bait monitoring, renewals, & ancillary | 688,186 | | | 605,533 | | | 535,494 | |
| Franchise revenues | 16,935 | | | 16,475 | | | 15,590 | |
| Other revenues | 22,519 | | | 17,222 | | | 17,025 | |
| Total Revenues | $ | 3,388,708 | | | $ | 3,073,278 | | | $ | 2,695,823 | |
Changes in unearned revenues were as follows:
| | | | | | | | | | | |
| Year Ended December 31, |
| 2024 | | 2023 |
| (in thousands) | | | |
| Beginning balance | $ | 210,059 | | | $ | 187,994 | |
| Deferral of unearned revenue | 267,100 | | | 253,776 | |
| Recognition of unearned revenue | (253,287) | | | (231,711) | |
| Ending balance | $ | 223,872 | | | $ | 210,059 | |
Revenue allocated to remaining performance obligations represents contracted revenue that has not yet been recognized (“contracted not recognized revenue”), which includes both unearned revenue and revenue that will be billed and recognized in future periods. The Company has no material contracted but not yet recognized revenue as of December 31, 2024 or December 31, 2023.
At December 31, 2024 and December 31, 2023, the Company had long-term unearned revenue of $43.0 million and $37.7 million, respectively. Unearned short-term revenue is recognized over the next 12-month period. We recognized $172.4 million and $158.1 million of revenue in the years ended December 31, 2024 and December 31, 2023, respectively, that was included in the balance of unearned revenue at the beginning of each respective fiscal year. The majority of unearned long-term revenue is recognized over a period of five years or less with immaterial amounts recognized through 2034.
Incremental Costs of Obtaining a Contract with a Customer
Incremental costs of obtaining a contract include only those costs that we incur to obtain a contract that we would not have incurred if the contract had not been obtained, primarily sales commissions. These costs are recorded as an asset and amortized to expense over the life of the contract to the extent such costs are expected to be recovered. As of December 31, 2024, we have $23.4 million of unamortized capitalized costs to obtain a contract, of which $19.3 million is recorded within other current assets and $4.1 million is recorded within other assets on our consolidated statement of financial position. During the year ended December 31, 2024, we recorded approximately $22.1 million amortization of capitalized costs, which is recorded within sales, general and administrative expense on our consolidated statement of income. As of December 31, 2023, we had $22.0 million of unamortized capitalized costs to obtain a contract, of which $15.3 million was recorded within other current assets and $6.7 million was recorded within other assets on our consolidated statement of financial position. During the year ended December 31, 2023, we recorded $8.6 million amortization of capitalized costs.
4. ALLOWANCE FOR EXPECTED CREDIT LOSSES
The Company is exposed to credit losses primarily related to accounts receivables and financed receivables derived from customer services revenue. To reduce credit risk for residential accounts receivable, we promote enrollment in our auto-pay programs. In general, we may suspend future services for customers with past due balances. The Company’s credit risk is generally low with a large number of entities comprising Rollins’ customer base and dispersion across many different geographical regions.
The Company manages its financed receivables on an aggregate basis when assessing and monitoring credit risks. The Company’s established credit evaluation and monitoring procedures seek to minimize the amount of business we conduct with higher risk customers. The credit quality of a potential obligor is evaluated at the loan origination based on an assessment of the individual’s Beacon/credit bureau score. Rollins requires a potential obligor to have good creditworthiness with low risk before entering into a contract. Depending upon the individual’s credit score, the Company may accept with 100% financing or require a significant down payment or turn down the contract. Delinquencies of accounts are monitored each month. Financed receivables include installment receivable amounts, some of which are due subsequent to one year from the balance sheet dates.
Financed receivables are generally written-off when deemed uncollectible or when 180 days have elapsed since the date of the last full contractual payment. The Company’s write-off policy has been consistently applied during the periods reported. Management considers the charge-off policy when evaluating the appropriateness of the allowance for expected credit losses. Gross write-offs as a percentage of average financed receivables were 8.1% and 9.2% for the twelve months ended December 31, 2024 and December 31, 2023, respectively.
The Company offers 90 days same-as-cash financing to some customers based on their creditworthiness. Interest is not recognized until the 91st day at which time it is calculated retrospectively back to the first day if the contract has not been paid in full. In certain circumstances, such as when delinquency is deemed to be of an administrative nature, accounts may still accrue interest when they reach 180 days past due. As of December 31, 2024, there were immaterial accounts greater than 180 days past due.
Included in financed receivables are notes receivable from franchise owners. The majority of these notes are low risk as the repurchase of these franchises is guaranteed by the Company’s wholly-owned subsidiary, Orkin Systems, LLC, and the repurchase price of the franchise is currently estimated and has historically been well above the receivable due from the franchise owner. Also included in notes receivables are franchise notes from other brands which are not guaranteed and do not have the same historical valuation.
The carrying amount of notes receivable approximates fair value as the interest rates approximate market rates for these types of contracts.
The Company’s allowances for credit losses for trade accounts receivable and financed receivables are developed using historical collection experience, current economic and market conditions, reasonable and supportable forecasts, and a review of the current status of customers’ receivables. The Company’s receivable pools are classified between residential customers, commercial customers, large commercial customers, and financed receivables. Accounts are written off against the allowance for credit losses when the Company determines that amounts are uncollectible, and recoveries of amounts previously written off are recorded when collected. The Company stops accruing interest to these receivables when they are deemed uncollectible. Below is a roll forward of the Company’s allowance for credit losses for the years ended December 31, 2024, 2023, and 2022.
| | | | | | | | | | | | | | | | | |
| Allowance for Credit Losses |
| (in thousands) | Trade
Receivables | | Financed
Receivables | | Total
Receivables |
| Balance at December 31, 2021 | $ | 13,885 | | | $ | 3,985 | | | $ | 17,870 | |
| Provision for expected credit losses | 13,701 | | | 5,740 | | | 19,441 | |
| Write-offs charged against the allowance | (18,861) | | | (4,757) | | | (23,618) | |
| Recoveries collected | 5,348 | | | — | | | 5,348 | |
| Balance at December 31, 2022 | $ | 14,073 | | | $ | 4,968 | | | $ | 19,041 | |
| Provision for expected credit losses | 16,309 | | | 10,551 | | | 26,860 | |
| Write-offs charged against the allowance | (20,397) | | | (9,917) | | | (30,314) | |
| Recoveries collected | 5,812 | | | — | | | 5,812 | |
| Balance at December 31, 2023 | $ | 15,797 | | | $ | 5,602 | | | $ | 21,399 | |
| Provision for expected credit losses | 22,695 | | | 11,331 | | | 34,026 | |
| Write-offs charged against the allowance | (24,819) | | | (9,167) | | | (33,986) | |
| Recoveries collected | 6,097 | | | 920 | | | 7,017 | |
| Balance at December 31, 2024 | $ | 19,770 | | | $ | 8,686 | | | $ | 28,456 | |
The following is a summary of the past due financed receivables:
| | | | | | | | | | | |
| At December 31, | 2024 | | 2023 |
| (in thousands) | | | |
| 30-59 days past due | $ | 4,473 | | | $ | 4,454 | |
| 60-89 days past due | 2,256 | | | 2,837 | |
| 90 days or more past due | 4,329 | | | 4,813 | |
| Total | $ | 11,058 | | | $ | 12,104 | |
The following is a summary of percentage of gross financed receivables:
| | | | | | | | | | | |
| At December 31, | 2024 | | 2023 |
| Current | 91.9 | % | | 89.7 | % |
| 30-59 days past due | 3.3 | % | | 3.8 | % |
| 60-89 days past due | 1.6 | % | | 2.4 | % |
| 90 days or more past due | 3.2 | % | | 4.1 | % |
| Total | 100.0 | % | | 100.0 | % |
5. EQUIPMENT AND PROPERTY, NET
Equipment and property are presented at cost less accumulated depreciation and are detailed as follows:
| | | | | | | | | | | |
| December 31, | 2024 | | 2023 |
| (in thousands) | | | |
| Buildings | $ | 54,600 | | | $ | 51,339 | |
| Operating equipment | 145,973 | | | 144,723 | |
| Furniture and fixtures | 25,383 | | | 22,035 | |
| Computer equipment and systems | 259,992 | | | 247,681 | |
| 485,948 | | | 465,778 | |
| Less: accumulated depreciation | (382,266) | | | (360,421) | |
| 103,682 | | | 105,357 | |
| Land | 21,157 | | | 21,304 | |
| Equipment and property, net | $ | 124,839 | | | $ | 126,661 | |
Included in computer equipment and systems at December 31, 2024 and 2023, are costs for internal use software of $160.4 million and $153.4 million, respectively. The related accumulated depreciation was $137.1 million and $127.5 million at December 31, 2024 and 2023, respectively.
Included in equipment and property, net at December 31, 2024 and 2023, are fixed assets held in foreign countries of $14.0 million, and $12.0 million, respectively.
Total depreciation expense was approximately $34.1 million in 2024, $33.3 million in 2023 and $35.6 million in 2022.
6. LEASES
The Company leases certain buildings, vehicles, and equipment in order to reduce the risk associated with ownership. The Company elected the practical expedient approach permitted under ASC Topic 842, “Leases” not to include short-term leases with a duration of 12 months or less on the balance sheet. As of December 31, 2024 and 2023, all leases were classified as operating leases. Building leases generally carry terms of 5 to 10 years with annual rent escalations at fixed amounts per the lease. Vehicle leases generally carry a fixed term of one year with renewal options to extend the lease on a monthly basis resulting in lease terms up to 7 years depending on the class of vehicle. The exercise of renewal options is at the Company’s sole discretion. It is reasonably certain that the Company will exercise the renewal options on its vehicle leases. The measurement of right-of-use assets and liabilities for vehicle leases includes the fixed payments associated with such renewal periods. We separate lease and non-lease components of contracts. Our lease agreements do not contain any material variable payments, residual value guarantees, early termination penalties or restrictive covenants.
The Company uses the rate implicit in the lease when available; however, most of our leases do not provide a readily determinable implicit rate. Accordingly, we estimate our incremental borrowing rate based on information available at lease commencement.
| | | | | | | | | | | | | | | | | | | | | | | | | | |
| (in thousands, except Other Information) | | | | Years Ended
December 31, |
| Components of Lease Expense | | Financial Statement Classification | | 2024 | | 2023 | | 2022 |
| Short-term lease cost | | Cost of services provided, Sales, general, and administrative expenses | | $ | 16,618 | | | $ | 14,753 | | | $ | 12,693 | |
| Operating lease cost | | Cost of services provided, Sales, general, and administrative expenses | | 133,420 | | | 110,627 | | | 97,764 | |
| Total lease expense | | | | $ | 150,038 | | | $ | 125,380 | | | $ | 110,457 | |
| | | | | | | | |
| Cash Flow Information | | | | | | | | |
| Cash paid for amounts included in the measurement of lease liabilities: | | | | | | | | |
| Operating cash flows for operating leases | | | | $ | 132,588 | | | $ | 109,631 | | | $ | 96,700 | |
| | | | | | | | |
| Other Information | | | | | | | | |
| Weighted-average remaining lease term - operating leases | | | | 4.4 Yrs | | 4.8 Yrs | | |
| Weighted-average discount rate - operating leases | | | | 4.30 | % | | 3.99 | % | | |
Lease Commitments
Future minimum lease payments, including assumed exercise of renewal options at December 31, 2024 were as follows:
| | | | | |
| (in thousands) | |
| 2025 | $ | 137,395 | |
| 2026 | 121,355 | |
| 2027 | 88,654 | |
| 2028 | 46,532 | |
| 2029 | 19,748 | |
| Thereafter | 49,934 | |
| Total future minimum lease payments | 463,618 | |
| Less: amount representing interest | (46,400) | |
| Total future minimum lease payments, net of interest | $ | 417,218 | |
Future commitments presented in the table above include lease payments in renewal periods for which it is reasonably certain that the Company will exercise the renewal option. Total future minimum lease payments for operating leases, including the amount representing interest, are comprised of $181.2 million for building leases and $282.4 million for vehicle leases. As of December 31, 2024, the Company had additional future obligations of $20.8 million for leases that had not yet commenced.
7. GOODWILL
Goodwill represents the excess of the purchase price over the fair value of net assets of businesses acquired. The carrying amount of goodwill was $1.2 billion as of December 31, 2024 and $1.1 billion as of December 31, 2023. Goodwill increased for the year ended December 31, 2024 primarily due to acquisitions.
The changes in the carrying amount of goodwill for the twelve months ended December 31, 2024 and 2023 were as follows (in thousands):
| | | | | |
| Goodwill: | |
| Balance at December 31, 2022 | $ | 846,704 | |
| Additions | 224,014 | |
| Measurement adjustments | — | |
| Dispositions | (2,466) | |
| Adjustments due to currency translation and other | 2,058 | |
| Balance at December 31, 2023 | 1,070,310 | |
| Additions | 97,914 | |
| Measurement adjustments | 464 | |
| Adjustments due to currency translation and other | (7,603) | |
| Balance at December 31, 2024 | $ | 1,161,085 | |
8. CUSTOMER CONTRACTS, TRADENAMES AND TRADEMARKS, AND OTHER INTANGIBLE ASSETS
Customer contracts are amortized on a straight-line basis as this best approximates the ratio that current revenues bear to the total of current and anticipated revenues based on the estimated lives of the assets. In accordance with the FASB ASC Topic 350 “Intangibles - Goodwill and other”, the expected lives of customer contracts were analyzed, and it was determined that customer contracts should be amortized over a life of 7 to 20 years dependent upon customer type.
The carrying amount and accumulated amortization for customer contracts were as follows:
| | | | | | | | | | | |
| December 31, | 2024 | | 2023 |
| (in thousands) | | | |
| Customer contracts | $ | 671,242 | | | $ | 625,920 | |
| Less: accumulated amortization | (288,150) | | | (239,768) | |
| Customer contracts, net | $ | 383,092 | | | $ | 386,152 | |
Trademarks and tradenames are amortized on a straight-line basis over the period of their useful lives. The Company has determined these assets have useful lives between 7 and 20 years. The Company also has non-amortizable, indefinite-lived tradenames of $137.8 million and $139.7 million as of December 31, 2024 and 2023, respectively.
The carrying amount and accumulated amortization for trademarks and tradenames were as follows:
| | | | | | | | | | | |
| December 31, | 2024 | | 2023 |
| (in thousands) | | | |
| Trademarks and tradenames | $ | 162,375 | | | $ | 161,301 | |
| Less: accumulated amortization | (12,480) | | | (9,933) | |
| Trademarks and tradenames, net | $ | 149,895 | | | $ | 151,368 | |
Other intangible assets include non-compete agreements and patents. Non-compete agreements are amortized on a straight-line basis over periods ranging from 3 to 20 years and patents are amortized on a straight-line basis over 15 years.
The carrying amount and accumulated amortization for other intangible assets were as follows:
| | | | | | | | | | | |
| December 31, | 2024 | | 2023 |
| (in thousands) | | | |
| Other intangible assets | $ | 26,507 | | | $ | 26,973 | |
| Less: accumulated amortization | (17,905) | | | (18,759) | |
| Other intangible assets, net | $ | 8,602 | | | $ | 8,214 | |
Total amortization expense was approximately $79.2 million in 2024, $66.5 million in 2023 and $55.7 million in 2022.
Estimated amortization expense for the existing carrying amount of customer contracts and other intangible assets for each of the five succeeding fiscal years are as follows:
| | | | | |
| (in thousands) | |
| 2025 | $ | 80,127 | |
| 2026 | 77,120 | |
| 2027 | 73,457 | |
| 2028 | 62,299 | |
| 2029 | 48,399 | |
9. FAIR VALUE MEASUREMENT
The Company’s financial instruments consist of cash and cash equivalents, trade receivables, financed and notes receivable, accounts payable, other short-term liabilities, and debt. The carrying amounts of these financial instruments approximate their respective fair values. The Company also has financial instruments related to its defined benefit pension plan and deferred compensation plan detailed in Note 11.
The fair value hierarchy has three levels based on the reliability of the inputs used to determine fair value. Level 1 refers to fair values determined based on quoted prices in active markets for identical assets. Level 2 refers to fair values estimated using significant other observable inputs, and Level 3 includes fair values estimated using significant non-observable inputs.
As of December 31, 2024 and 2023, the Company had investments in international bonds of $8.2 million and $10.2 million, respectively. These bonds are accounted for as available for sale securities and are level 2 assets under the fair value hierarchy. At December 31, 2024, $1.0 million was included in other current assets and $7.2 million was included in other assets. At December 31, 2023, $1.0 million was included in other current assets and $9.2 million was included in other assets. The bonds are recorded at fair market value with unrealized gains or losses included in other comprehensive income. During the years ended December 31, 2024, 2023 and 2022, unrealized gains or losses included in other comprehensive income were insignificant.
At December 31, 2024 and 2023, respectively, the Company had $21.0 million and $46.1 million of acquisition holdback and earnout liabilities with the former owners of acquired companies. Acquisition earnouts are generally earned by achieving certain levels of revenue growth while maintaining certain profit margins. The earnout liabilities are discounted to reflect the expected probability of payout, and both earnout and holdback liabilities are discounted to their net present value on the Company’s books and are considered Level 3 liabilities.
The table below presents a summary of the changes in fair value for these liabilities.
| | | | | |
| (in thousands) | |
| Acquisition holdback and earnout liabilities at December 31, 2022 | $ | 13,496 | |
| New acquisitions and measurement adjustments | 44,548 | |
| Payouts | (12,489) | |
| Interest and fair value adjustments | 2,981 | |
| Charge offset, forfeit and other | (2,432) | |
| Acquisition holdback and earnout liabilities at December 31, 2023 | 46,104 | |
| New acquisitions and measurement adjustments | 21,052 | |
| Payouts | (43,948) | |
| Interest and fair value adjustments | (1,099) | |
| Charge offset, forfeit and other | (1,101) | |
| Acquisition holdback and earnout liabilities at December 31, 2024 | $ | 21,008 | |
10. DEBT
On February 24, 2023, the Company entered into a revolving credit agreement ("the Credit Agreement") with, among others, JPMorgan Chase Bank, N.A. (“JPMorgan Chase”), as administrative agent (in such capacity, the “Administrative Agent”), which refinanced its previous credit facility described below.
The Credit Agreement provides for a $1.0 billion revolving credit facility (the “Credit Facility”), which may be denominated in U.S. Dollars and other currencies, including Euros, Australian Dollars, Canadian Dollars, New Zealand Dollars, Pounds Sterling and Japanese Yen, subject to a $400 million foreign currency sublimit. The Credit Facility also includes sub-facilities for the issuance of letters of credit of up to $150 million and swing line loans at the Administrative Agent’s discretion of up to $50 million. Certain subsidiaries of Rollins provide unsecured guarantees of the Credit Facility. Rollins has the ability to expand its borrowing availability under the Credit Agreement in the form of increased revolving commitments or one or more tranches of term loans by up to an additional $750 million, subject to the agreement of the participating lenders and certain other customary conditions. The maturity date of the loans under the Credit Agreement is February 24, 2028.
Loans under the Credit Agreement bear interest, at Rollins’ election, at (i) for loans denominated in U.S. Dollars, (A) an alternate base rate (subject to a floor of 0.00%), which is the greatest of (x) the prime rate publicly announced from time to time by JPMorgan Chase, (y) the greater of the federal funds effective rate and the Federal Reserve Bank of New York overnight bank funding rate, plus 50 basis points, and (z) Adjusted Term SOFR for a one month interest period, plus a margin ranging from 0.00% to 0.50% per annum based on Rollins’ consolidated total net leverage ratio; or (B) the greater of term SOFR for the applicable interest period plus 10 basis points (“Adjusted Term SOFR”) and zero, plus a margin ranging from 1.00% to 1.50% per annum based on Rollins’ consolidated total net leverage ratio; and (ii) for loans denominated in other currencies, including Euros, Australian Dollars, Canadian Dollars, New Zealand Dollars, Pounds Sterling and Japanese Yen, such interest rates as set forth in the Credit Agreement.
The Credit Agreement contains customary terms and conditions, including, without limitation, certain financial covenants including covenants restricting Rollins’ ability to incur certain indebtedness or liens, or to merge or consolidate with or sell substantially all of its assets to another entity. Further, the Credit Agreement contains a financial covenant restricting Rollins’ ability to permit the ratio of Rollins’ consolidated total net debt to EBITDA to exceed 3.50 to 1.00. Following certain acquisitions, Rollins may elect to increase the financial covenant level to 4.00 to 1.00 temporarily. The ratio is calculated as of the last day of the fiscal quarter most recently ended. The Credit Agreement also contains provisions permitting a future environmental, social and governance amendment, subject to certain terms and conditions contained therein, by which pricing may be adjusted pursuant to the Company's performance measured against certain sustainability-linked metrics. The Company is in compliance with applicable financial debt covenants as of December 31, 2024.
As of December 31, 2024, the Company had outstanding borrowings of $397.0 million under the Credit Facility. Borrowings under the Credit Facility are presented under the long-term debt caption of our consolidated balance sheet, net of $1.7 million in unamortized debt issuance costs as of December 31, 2024. The aggregate effective interest rate on the debt outstanding as of December 31, 2024 was 5.5%.
The Company maintains $72.0 million in letters of credit as of December 31, 2024. These letters of credit are required by the Company’s insurance companies, due to the Company’s high deductible insurance program, to secure various workers’ compensation and casualty insurance contracts coverage and were increased from $71.7 million as of December 31, 2023. The Company believes that it has adequate liquid assets, funding sources and insurance accruals to accommodate potential future insurance claims.
As of December 31, 2023, the Company had outstanding borrowings of $493.0 million under the Credit Facility. Borrowings under the Credit Facility are presented under the long-term debt caption of our consolidated balance sheet, net of $2.2 million in unamortized debt issuance costs as of December 31, 2023. The aggregate effective interest rate on the debt outstanding as of December 31, 2023 was 6.5%.
11. EMPLOYEE BENEFIT PLANS
Defined Benefit Pension Plans
The Company has sponsored noncontributory tax-qualified defined benefit pension plans covering employees meeting certain age and service requirements, the most significant of which was the Rollins, Inc. Plan, which was terminated in 2018. The Company funds its plans with at least the minimum amount required by ERISA.
Defined Contribution 401(k) Savings Plan
The Company sponsors a defined contribution 401(k) Savings Plan (the “Plan”) that is available to a majority of the Company’s full-time employees the first day of the calendar quarter following completion of three months of service. The Plan is available to non-full-time employees the first day of the calendar quarter following one year of service upon completion of 1000 hours in that year. The Plan provides for a matching contribution of one dollar ($1.00) for each one dollar ($1.00) of a participant’s contributions to the Plan that do not exceed 3 percent of his or her eligible compensation (which includes commissions, overtime, and bonuses) and fifty cents ($0.50) for each one dollar ($1.00) of a participant’s contributions to the Plan over the initial 3 percent that do not exceed 6 percent of his or her eligible compensation (which includes commissions, overtime and bonuses). The charge to expense for the Company match was approximately $35.8 million, $32.9 million and $29.9 million for the years ended December 31, 2024, 2023 and 2022, respectively. At December 31, 2024, 2023, and 2022 approximately 28.4%, 30.4%, and 30.6%, respectively, of the fair value of plan assets consisted of Rollins, Inc. common stock. Total administrative fees paid by the Company for the Plan were insignificant for each of the years ended December 31, 2024, 2023 and 2022.
Nonqualified Deferred Compensation Plan
The Deferred Compensation Plan provides that participants may defer up to 50% of their base salary and up to 85% of their annual bonus with respect to any given plan year, subject to a $2 thousand per plan year minimum. The Company may make discretionary contributions to participant accounts but has not done so since 2011.
Accounts will be credited with hypothetical earnings, and/or debited with hypothetical losses, based on the performance of certain “Measurement Funds.” Account values are calculated as if the funds from deferrals and Company credits had been converted into shares or other ownership units of selected Measurement Funds by purchasing (or selling, where relevant) such shares or units at the current purchase price of the relevant Measurement Fund at the time of the participant’s selection. Deferred Compensation Plan benefits are unsecured general obligations of the Company to the participants, and these obligations rank in parity with the Company’s other unsecured and unsubordinated indebtedness. The Company has established a “rabbi trust,” which it uses to voluntarily set aside amounts to indirectly fund any obligations under the Deferred Compensation Plan. To the extent that the Company’s obligations under the Deferred Compensation Plan exceed assets available under the trust, the Company would be required to seek additional funding sources to fund its liability under the Deferred Compensation Plan.
Generally, the Deferred Compensation Plan provides for distributions of any deferred amounts upon the earliest to occur of a participant’s death, disability, retirement or other termination of employment (a “Termination Event”). However, for any deferrals of salary and bonus (but not Company contributions), participants would be entitled to designate a distribution date which is prior to a Termination Event. Generally, the Deferred Compensation Plan allows a participant to elect to receive distributions under the Deferred Compensation Plan in installments or lump-sum payments.
At December 31, 2024, the Deferred Compensation Plan had 73 life insurance policies with a net face value of $50.7 million compared to 75 policies with a face value of $48.4 million at December 31, 2023. The cash surrender value of these life insurance policies was $27.6 million and $25.5 million at December 31, 2024 and 2023, respectively. These policies are valued using the NAV practical expedient.
The following table presents our non-qualified deferred compensation plan assets using the fair value hierarchy as of December 31, 2024 and 2023.
| | | | | | | | | | | | | | | | | | | | | | | | | | | | | |
| (in thousands) | Level 1 | | Level 2 | | Level 3 | | NAV | | Total |
| December 31, 2024 | $ | 25 | | | $ | — | | | $ | — | | | $ | 27,558 | | | $ | 27,583 | |
| December 31, 2023 | $ | 25 | | | $ | — | | | $ | — | | | $ | 25,461 | | | $ | 25,486 | |
Cash and cash equivalents, which are used to pay benefits and deferred compensation plan administrative expenses, are held in money market funds.
Total expense related to deferred compensation was $0.3 million, $0.3 million, and $1.1 million in 2024, 2023, and 2022, respectively. The Company had $27.6 million and $25.5 million in deferred compensation assets as of December 31, 2024 and 2023, respectively, included within other assets on the Company’s consolidated statements of financial position and $18.9 million and $19.8 million in deferred compensation liability as of December 31, 2024 and 2023, respectively, located within other current liabilities and long-term accrued liabilities on the Company’s consolidated statements of financial position. The amounts of assets were marked to fair value.
12. COMMITMENTS AND CONTINGENCIES
In the normal course of business, the Company and its subsidiaries are involved in, and will continue to be involved in, various claims, arbitrations, contractual disputes, investigations, litigation, environmental and tax and other regulatory matters relating to, and arising out of, our businesses and our operations. These matters may involve, but are not limited to, allegations that our services or vehicles caused damage or injury, claims that our services did not achieve the desired results (including claims that we are responsible for termite damage to a structure), and claims related to acquisitions and allegations by federal, state or local authorities, including taxing authorities, of violations of regulations or statutes. In addition, we are parties to employment-related cases and claims from time to time, which may include claims on a representative or class action basis alleging wage and hour law violations or claims related to the operation of our retirement benefit plans. We are also involved from time to time in certain environmental matters primarily arising in the normal course of business. We evaluate pending and threatened claims and establish loss contingency reserves based upon outcomes we currently believe to be probable and reasonably estimable in accordance with ASC 450.
The Company retains, up to specified limits, certain risks related to general liability, workers’ compensation and auto liability. The estimated costs of existing and future claims under the retained loss program are accrued based upon historical trends as incidents occur, whether reported or unreported (although actual settlement of the claims may not be made until future periods) and may be subsequently revised based on developments relating to such claims. The Company contracts with an independent third party to provide the Company an estimated liability based upon historical claims information. The actuarial study is a major consideration in establishing the reserve, along with management’s knowledge of changes in business practice and existing claims compared to current balances. Management’s judgment is inherently subjective as a number of factors are outside management’s knowledge and control. Additionally, historical information is not always an accurate indication of future events. The accruals and reserves we hold are based on estimates that involve a degree of judgment and are inherently variable and could be overestimated or insufficient. If actual claims exceed our estimates, our operating results could be materially affected, and our ability to take timely corrective actions to limit future costs may be limited.
Item 103 of SEC Regulation S-K requires disclosure of certain environmental legal proceedings if the proceeding reasonably involves potential monetary sanctions of $300,000 or more. The Company has received a notice of alleged violations and information requests from local governmental authorities in California for our Orkin and Clark Pest Control operations and is currently working with several local governments regarding compliance with environmental regulations governing the management of hazardous waste and pesticide disposal. The investigation appears to be part of a broader effort to investigate waste handling and disposal processes of a number of industries. While we are unable to predict the outcome of this investigation, we do not believe the outcome will have a material effect on our results of operations, financial condition, or cash flows.
Management does not believe that any pending claim, proceeding or litigation, regulatory action or investigation, either alone or in the aggregate, will have a material adverse effect on the Company’s financial position, results of operations or liquidity; however, it is possible that an unfavorable outcome of some or all of the matters could result in a charge that might be material to the results of an individual quarter or year.
13. STOCKHOLDERS' EQUITY
During the year ended December 31, 2024, the Company paid $298.1 million, or $0.615 per share, in cash and stock dividends compared to $264.3 million, or $0.540 per share, during the same period in 2023.
On September 6, 2023, the Company entered into an underwriting agreement (the “Underwriting Agreement”) with LOR, Inc. (“LOR”) (a company controlled by Mr. Gary W. Rollins and certain members of his family) and Goldman Sachs & Co. LLC and Morgan Stanley & Co. LLC, as representatives of the several underwriters (the “Underwriters”), relating to the offer by LOR of 38,724,100 shares of the Company’s common stock, par value $1.00 per share (the “Common Stock”), at a public offering price of $35.00 per share (the “Offering”). In connection with the Offering, LOR granted the Underwriters an option to purchase up to an additional 5,785,714 shares of Common Stock (the “Optional Shares”). The Offering, including the sale of the Optional Shares, closed on September 11, 2023. The Company did not sell any shares in the Offering and did not receive any proceeds from the Offering. In addition, the Company completed the repurchase of 8,724,100 of the shares of Common Stock offered in the Offering for approximately $300 million at $34.39 per share.
As we repurchase our common stock, we reduce common stock for par value of the shares repurchased, with the excess of the purchase price over par value recorded as a reduction to additional paid-in capital and retained earnings.
The Company did not repurchase shares on the open market during the years ended December 31, 2024 and 2023.
The Company repurchases shares from employees for the payment of their taxes on restricted shares that have vested. The Company repurchased $11.6 million and $10.8 million during the years ended December 31, 2024 and 2023, respectively.
During the years ended December 31, 2024 and 2023, the Company issued $4.8 million and $2.0 million of shares to employees in connection with the Employee Stock Purchase Plan ("ESPP") discussed below.
Stock Compensation Plans
Time-Lapsed Restricted Shares and Performance Share Unit Awards
Time-lapsed restricted share awards and restricted stock units (“restricted shares”) have been issued to officers and other employees, and annual share awards are made to non-employee directors, under the Company’s Employee Stock Incentive Plan. Additionally, in 2023 and 2024, performance share units ("PSUs") were granted to the Company's executive officers. The PSUs will vest and convert to shares of common stock at the end of a three-year performance period upon the Company's successful achievement of certain financial and market performance goals.
The Company recognizes compensation expense for the unvested portion of awards outstanding over the remainder of the service period. The compensation cost recorded for these awards is based on the Company's closing stock price at the grant date less the cost of estimated forfeitures. Forfeitures are estimated at the time of grant and revised, if necessary, in subsequent periods to reflect actual forfeitures. For PSUs that are granted with a total shareholder return ("TSR") component, management estimates the fair value using a Monte Carlo simulation valuation model, as these awards are subject to a market condition.
Restricted shares and PSUs provide for the issuance of a share of the Company’s common stock at no cost to the holder and generally vest after a certain stipulated number of years from the grant date, depending on the terms of the issue. Restricted shares and PSUs typically vest over approximately one to six-year periods. During these years, grantees of certain awards receive all dividends declared and retain voting rights for the granted shares. The agreements under which the one-time grant of restricted stock is issued provide that shares awarded may not be sold or otherwise transferred until restrictions established under the plans have lapsed.
The Company issued time-lapsed restricted shares and PSUs of 0.7 million, 0.7 million, and 0.9 million for the years ended December 31, 2024, 2023, and 2022, respectively. The Company issues new shares from its authorized but unissued share
pool. At December 31, 2024, approximately 4.6 million shares of the Company’s common stock were reserved for issuance.
The following table summarizes the components of the Company’s stock-based compensation programs recorded as expense:
| | | | | | | | | | | | | | | | | |
| (in thousands) | 2024 | | 2023 | | 2022 |
| Restricted shares and PSUs: | | | | | |
| Compensation expense | $ | 28,795 | | | $ | 24,222 | | | $ | 20,816 | |
The total income tax benefit related to stock-based compensation awards recognized in income was $5.5 million, $5.2 million, and $4.7 million for the years ended December 31, 2024, 2023, and 2022, respectively. As of December 31, 2024 and 2023, $55.3 million and $50.0 million, respectively, of total unrecognized compensation cost related to restricted shares and PSUs are expected to be recognized over a weighted average period of approximately 3.1 years and 2.8 years at December 31, 2024 and 2023, respectively.
The following table summarizes information on unvested awards outstanding as of December 31, 2024, 2023 and 2022.
| | | | | | | | | | | |
| (number of shares in thousands) | Number of
Shares | | Weighted
Average
Grant-Date
Fair Value |
| Unvested as of December 31, 2021 | 2,596 | | $ | 26.16 | |
| Forfeited | (90) | | 26.37 | |
| Vested | (675) | | 19.99 | |
| Granted | 854 | | 30.12 | |
| Unvested as of December 31, 2022 | 2,685 | | $ | 28.97 | |
| Forfeited | (98) | | 29.83 | |
| Vested | (840) | | 26.87 | |
| Granted | 678 | | 36.10 | |
| Unvested as of December 31, 2023 | 2,425 | | $ | 31.66 | |
| Forfeited | (113) | | 35.19 | |
| Vested | (758) | | 29.87 | |
| Granted | 873 | | 40.39 | |
| Performance Attainment Adjustment | 62 | | 36.30 | |
| Unvested as of December 31, 2024 | 2,489 | | $ | 35.46 | |
Employee Stock Purchase Plan
On April 26, 2022, shareholders approved the Rollins, Inc. 2022 Employee Stock Purchase Plan (“ESPP”) which provides eligible employees with the option to purchase shares of Company common stock, at a discount, through payroll deductions during six-month offering periods. Initially, a maximum of 1,000,000 shares of the Company’s common stock are authorized for issuance under the ESPP. Under the ESPP, shares of common stock may be purchased by eligible participants during defined purchase periods at 90% of the lesser of the closing price of the Company’s common stock on the first day or last day of each purchase period. The first offering period for the ESPP began on July 1, 2022. The Company recorded compensation expense of $1.2 million, $0.4 million, and $0.4 million in connection with the ESPP for the years ended December 31, 2024, 2023, and 2022, respectively. Compensation expense for the ESPP is included in cost of services provided and sales, general and administrative expenses in our consolidated statements of income.
14. ACCUMULATED OTHER COMPREHENSIVE LOSS
Accumulated other comprehensive loss consists of the following (in thousands):
| | | | | | | | | | | | | | | | | | | | | | | | | |
| Pension Liability
Adjustment | | Foreign
Currency
Translation | | | | Available for
Sale Securities | | Total |
| Balance at December 31, 2021 | $ | (322) | | | $ | (16,089) | | | | | $ | — | | | $ | (16,411) | |
| Change during 2022: | | | | | | | | | |
| Before-tax amount | — | | | (14,215) | | | | | (936) | | | (15,151) | |
| Tax (expense) benefit | — | | | — | | | | | — | | | — | |
| Other comprehensive (loss) income | — | | | (14,215) | | | | | (936) | | | (15,151) | |
| Balance at December 31, 2022 | (322) | | | (30,304) | | | | | (936) | | | (31,562) | |
| Change during 2023: | | | | | | | | | |
| Before-tax amount | (290) | | | 4,816 | | | | | 206 | | | 4,732 | |
| Tax (expense) benefit | 75 | | | — | | | | | — | | | 75 | |
| Other comprehensive loss | (215) | | | 4,816 | | | | | 206 | | | 4,807 | |
| Balance at December 31, 2023 | (537) | | | (25,488) | | | | | (730) | | | (26,755) | |
| Change during 2024: | | | | | | | | | |
| Before-tax amount | — | | | (17,318) | | | | | 146 | | | (17,172) | |
| Tax (expense) benefit | — | | | 293 | | | | | — | | | 293 | |
| Other comprehensive income (loss) | — | | | (17,025) | | | | | 146 | | | (16,879) | |
| Balance at December 31, 2024 | $ | (537) | | | $ | (42,513) | | | | | $ | (584) | | | $ | (43,634) | |
15. INCOME TAXES
For the years ended December 31, income from continuing operations before income taxes consisted of the following:
| | | | | | | | | | | | | | | | | |
| (in thousands) | 2024 | | 2023 | | 2022 |
| Income before income taxes | | | | | |
| Domestic | $ | 592,704 | | | $ | 548,428 | | | $ | 465,991 | |
| Foreign | 37,526 | | | 37,829 | | | 32,926 | |
| Total income from continuing operations before income taxes | $ | 630,230 | | | $ | 586,257 | | | $ | 498,917 | |
For the years ended December 31, the Company’s income tax provision consisted of the following:
| | | | | | | | | | | | | | | | | |
| 2024 | | 2023 | | 2022 |
| (in thousands) | | | | | |
| Current: | | | | | |
| Federal | $ | 126,246 | | | $ | 112,647 | | | $ | 92,793 | |
| State | 36,328 | | | 33,516 | | | 26,786 | |
| Foreign | 11,613 | | | 12,781 | | | 9,144 | |
| Total current tax expense | 174,187 | | | 158,944 | | | 128,723 | |
| Deferred: | | | | | |
| Federal | (6,848) | | | (2,349) | | | (333) | |
| State | (2,336) | | | (2,925) | | | 2,011 | |
| Foreign | (1,152) | | | (2,370) | | | (83) | |
| Total deferred tax (benefit) expense | (10,336) | | | (7,644) | | | 1,595 | |
| Total income tax provision | $ | 163,851 | | | $ | 151,300 | | | $ | 130,318 | |
The following table presents the principal components of the difference between the effective tax rate and the U.S. federal statutory income tax rate for the years ended December 31:
| | | | | | | | | | | | | | | | | |
| 2024 | | 2023 | | 2022 |
| (in thousands) | | | | | |
| Income tax at statutory rate | $ | 132,348 | | | $ | 123,114 | | | $ | 104,773 | |
| State income tax expense (net of federal benefit) | 26,854 | | | 24,167 | | | 22,750 | |
| Foreign tax rate differential | 2,071 | | | 1,948 | | | 1,907 | |
| Tax on unremitted earnings | 355 | | | 1,408 | | | 549 | |
| Federal tax credits | (1,296) | | | (1,362) | | | (616) | |
| Permanent items | 2,773 | | | 2,239 | | | 445 | |
| Other reconciling items | 746 | | | (214) | | | 510 | |
| Total income tax provision | $ | 163,851 | | | $ | 151,300 | | | $ | 130,318 | |
Deferred income taxes reflect the net tax effects of the temporary differences between the carrying amounts of assets and liabilities for financial reporting purposes and income tax purposes. The Company’s deferred tax assets and liabilities as of December 31, 2024 and 2023 are as follows:
| | | | | | | | | | | |
| 2024 | | 2023 |
| (in thousands) | | | |
| Deferred tax assets: | | | |
| Employee compensation and benefits | $ | 15,146 | | | $ | 15,451 | |
| Unearned revenues | 15,243 | | | 13,998 | |
| Insurance reserves | 29,773 | | | 24,152 | |
| Lease liabilities | 118,382 | | | 90,486 | |
| Non-amortizable intangible assets | 7,792 | | | 6,883 | |
| Other deferred tax assets | 16,415 | | | 14,944 | |
| Total deferred tax assets | 202,751 | | | 165,914 | |
| Valuation allowance | (7,792) | | | (6,883) | |
| Net deferred tax assets | $ | 194,959 | | | $ | 159,031 | |
| Deferred tax liabilities: | | | |
| Fixed assets and depreciation | $ | 9,599 | | | $ | 12,430 | |
| Intangible assets | 93,872 | | | 81,194 | |
| Right of use assets | 102,299 | | | 81,971 | |
| Other deferred tax liabilities | — | | | — | |
| Total deferred tax liabilities | $ | 205,770 | | | $ | 175,595 | |
| Net deferred taxes | | | |
| Deferred tax assets | 4,841 | | | 2,294 | |
| Deferred tax liabilities | (15,652) | | | (18,858) | |
| Net deferred taxes | $ | (10,811) | | | $ | (16,564) | |
Deferred tax assets are included in "Other assets" and deferred tax liabilities are included in "Other long-term accrued liabilities" on the balance sheet.
In assessing the realizability of deferred tax assets, management considers whether it is more likely than not that some portion or all the deferred tax assets will not be realized. As of December 31, 2024, the Company increased its valuation allowance by approximately $0.9 million related to deferred tax assets on intangible assets held in Australia. The Company does not expect to recognize such deferred tax assets as it expects to continue its operations in Australia for the foreseeable future and the related intangible assets are not amortizable for tax purposes in Australia.
The changes in the Company’s valuation allowance for deferred tax assets are as follows:
| | | | | |
| (in thousands) | |
| December 31, 2022 | $ | — | |
| Charged to income tax expense | 962 | |
| Charged to other accounts | 5,921 | |
| December 31, 2023 | 6,883 | |
| Charged to income tax expense | 909 | |
| Charged to other accounts | — | |
| December 31, 2024 | $ | 7,792 | |
As of December 31, 2024, the Company has no net operating loss carryforwards in any federal, state, or foreign jurisdictions. The Company has a $0.2 million foreign tax credit carryforward which if not fully utilized will expire in 2026. The Company also has state tax credit carryforwards of $1.3 million which will begin to expire in 2026 if not fully utilized.
We intend to continue to grow the business in the international markets where we have a presence. As of December 31, 2024, we assert that foreign cash earnings in excess of working capital and cash needed for strategic investments and acquisitions are not intended to be indefinitely reinvested offshore and we have included the tax effects of such current and/or future repatriations, including applicable state taxes and foreign withholding tax of such cash earnings in these financial statements. Any non-cash unremitted earnings in our foreign subsidiaries are considered to be permanently reinvested and deferred taxes have not been provided on these earnings.
The total amount of unrecognized tax benefits as of December 31, 2024 that, if recognized, would affect the effective tax rate is $1.6 million. A reconciliation of the beginning and ending amount of unrecognized tax benefits is as follows:
| | | | | | | | | | | | | | | | | |
| December 31, | 2024 | | 2023 | | 2022 |
| (in thousands) | | | | | |
| Unrecognized tax benefits at beginning of year | $ | 1,784 | | | $ | 1,394 | | | $ | 1,018 | |
| Additions for tax positions of prior years | — | | | 653 | | | 376 | |
| Reductions for tax positions of prior years | (39) | | | (263) | | | — | |
| Settlements with taxing authorities | (161) | | | — | | | — | |
| Unrecognized tax benefits at end of year | $ | 1,584 | | | $ | 1,784 | | | $ | 1,394 | |
As of December 31, 2024, the Company believes it is reasonably possible that the amount of unrecognized tax benefits may decrease by $1.4 million over the next 12 months as it relates to U.S. federal and foreign jurisdictions.
The Company’s policy is to record interest and penalties related to income tax matters in income tax expense. Accrued interest and penalties were $0.6 million, $0.6 million and $0.2 million as of December 31, 2024, 2023 and 2022, respectively.
The Company files U.S. federal income tax returns, as well as separate and combined income tax returns in numerous state and foreign jurisdictions. The Company is under examination in certain state jurisdictions for years ranging from 2019 through 2021. The Company regularly assesses the outcomes of both ongoing and future examinations for the current or prior years to determine whether the Company’s provision for income taxes is sufficient. The Company recognizes liabilities based on estimates of whether additional taxes will be due and believes its reserves are adequate in relation to any potential assessments. The outcome of any one examination, some of which may conclude during the next 12 months, is not expected to have a material impact on the Company’s financial position or results of operations.
16. RELATED PARTY TRANSACTIONS
Aircraft and Administrative Arrangements
In 2014, P.I.A. LLC, a company then owned by our late Chairman of the Board of Directors, R. Randall Rollins, purchased a Lear Model 35A jet and entered into a lease arrangement with the Company for company use of the aircraft for business purposes. P.I.A. LLC is now owned by a trust for the benefit of the late Mr. Rollins’ family. The Company terminated the lease in 2024. The Company paid $100 per month in rent for the leased aircraft, and all variable costs and expenses associated with the leased aircraft, such as the costs for fuel, maintenance, storage and pilots. The Company had the priority right to use of the aircraft on business days, and Rollins family members and guests had the right to use the aircraft for personal use through the terms of an Aircraft Time Sharing Agreement with the Company. During 2024, the Company did not use the aircraft, but paid $500 in rent during the year ended December 31, 2024. During the years ended December 31, 2023 and 2022, the Company paid or incurred approximately $0.6 million, and $0.3 million in rent and operating costs under the Aircraft Time Sharing Agreement, respectively.
In August 2023, GWRG450, LLC (“GWR LLC”), a company wholly-owned by Gary W. Rollins, purchased a Gulfstream 450 aircraft (the “G450”). In connection with the G450 purchase, the Company entered a lease arrangement with GWR LLC to lease the G450 for corporate purposes from time to time. That lease arrangement was superseded and replaced effective January 1, 2024 with a Non-Exclusive Part 91 (Dry) Aircraft Lease Agreement between the Company and GWR, LLC (the “Dry Lease”). Pursuant to the Dry Lease, the Company has access to the aircraft for business purposes. The Company pays GWR, LLC an hourly flight rent with a minimum charge per use of $15,000 per round trip with a minimum annual rental commitment of $300,000. In addition, as consideration for access to the aircraft, the Company pays $300,000 of its annual maintenance charges, a portion of costs for the maintenance contractor and the state and local sales tax on the rental payments. The Dry Lease expires on June 30, 2025 unless sooner terminated or extended pursuant to its terms. The Company paid $0.6 million to GWR LLC for the year ended December 31, 2024 pursuant to the Dry Lease.
Pursuant to a Pilot Sharing Agreement (the “Pilot Sharing Agreement”), amended September 30, 2024, among the Company, LOR, and Mr. Gary W. Rollins ("GWR"): (1) the Company agrees to provide pilot services and training to LOR and GWR to operate aircraft they own directly or indirectly, (2) LOR agrees to reimburse the Company for 50% of the pilot services and training, and (3) LOR agrees to reimburse the Company for the pilot expenses for the LOR aircraft. Charges to LOR under the Pilot Sharing Agreement totaled $0.5 million, $0.5 million and $0.6 million for the years ended December 31, 2024, 2023 and 2022, respectively.
Pursuant to the Administrative Services Agreement (the “Administrative Services Agreement”) among the Company, LOR and GWR LLC, the Company provides certain services to LOR and GWR LLC. Among other fees, LOR and GWR LLC each agree to pay for a third of all aircraft hanger related expenses, and LOR agrees to pay a hut rental fee. The Company also provides accounting services and accounts payable services related to all aviation activities and employs or contracts for pilots for all such aircraft. Charges to LOR and GWR LLC for rent and administrative services totaled $2.2 million, $1.1 million and $0.8 million for the years ended December 31, 2024, 2023 and 2022, respectively.
The foregoing aircraft and administrative services arrangements were previously approved by the Company’s Nominating and Corporate Governance Committee.
Related Party Franchise Agreement
On each of December 1, 2019 and October 1, 2024, Orkin, a subsidiary of the Company entered into a franchise agreement with Wilson Pest Management, Inc. The franchises are owned 100% by John Wilson IV. The Company received a total of approximately $0.2 million during each of the years ended December 31, 2024, 2023 and 2022, respectively. John Wilson IV is the son of John F. Wilson, Executive Chairman of the Company. The Company's Nominating and Corporate Governance Committee approved the agreements in accordance with its Related Party Transactions policy.
Registration Rights Agreement and Secondary Offering
On September 6, 2023, the Company entered into the Underwriting Agreement with LOR and the Underwriters, relating to the Offering. In connection with the Offering, LOR granted the Underwriters an option to purchase Optional Shares. The Offering, including the sale of the Optional Shares, closed on September 11, 2023. The Company did not sell any shares in the Offering and did not receive any proceeds from the Offering. In addition, the Company completed the repurchase from
LOR of 8,724,100 of the shares of Common Stock offered in the Offering for approximately $300 million at the same per share price paid by the Underwriters to LOR in the Offering, or $34.39 per share.
On June 5 2023, the Company entered into a registration rights agreement (the “Registration Rights Agreement”) with LOR and LOR paid $1.5 million to the Company and upon closing the Offering, LOR paid $3.5 million to the Company pursuant to the Registration Rights Agreement. Pursuant to the Registration Rights Agreement, the Company will pay all costs, fees and expenses incident to the Company’s performance or compliance with the Registration Rights Agreement with respect to a total of five (5) requested offerings, and thereafter, LOR will be responsible for all such expenses in connection with any subsequent offering. These cash receipts were included in other financing activities in our consolidated statement of cash flows.
In connection with the Offering, LOR entered into a lock-up agreement with the Underwriters for a period of 365 days from the pricing date of the Offering, during which time LOR was restricted from engaging in certain transactions with respect to its shares of the Company’s common stock. The Offering was made pursuant to the Company’s existing registration statement on Form S-3, previously filed with the SEC and declared effective by the SEC on June 22, 2023, as supplemented by the prospectus supplement dated September 6, 2023, filed with the SEC pursuant to Rule 424(b)(5) under the Securities Act of 1933, as amended.
The Underwriting Agreement contains customary representations, warranties and covenants of the Company and LOR and also provides for customary indemnification by each of the Company, LOR and the Underwriters against certain liabilities. The foregoing description of the Underwriting Agreement is not meant to be a complete description and is qualified in its entirety by the Underwriting Agreement.
17. RESTRUCTURING COSTS
During 2023, the Company executed a restructuring program to modernize its workforce. These changes were primarily across corporate-related functions and enabled us to make more strategic improvements in our support functions. As a result of this program, the Company incurred $5.2 million in restructuring costs, consisting mainly of one-time termination benefits, including severance and outplacement services, stock-based compensation, and other benefits-related costs. These costs are recorded within restructuring costs in our consolidated statement of income. As of December 31, 2023, the Company had accrued restructuring costs of $2.1 million, which are included in accrued compensation and related liabilities in our consolidated balance sheet. No such costs were incurred during 2024 and as of December 31, 2024 we have no remaining obligation associated with this program.
18. EARNINGS PER SHARE
The Company reports both basic and diluted earnings per share. Basic earnings per share is computed by dividing net income available to participating common stockholders by the weighted average number of participating common shares outstanding for the period. Diluted earnings per share is calculated by dividing the net income available to participating common stockholders by the diluted weighted average number of shares outstanding for the period. The diluted weighted average number of shares outstanding is the basic weighted number of shares adjusted for any potentially dilutive equity.
The following table sets forth the computation of basic and diluted earnings per share under the two-class method (in thousands, except per share data):
| | | | | | | | | | | | | | | | | |
| Year Ended December 31, | 2024 | | 2023 | | 2022 |
| Net income available to stockholders | $ | 466,379 | | | $ | 434,957 | | | $ | 368,599 | |
| Less dividends paid: | | | | | |
| Common stock | (296,818) | | | (263,016) | | | (210,509) | |
| Time-lapse restricted awards | (1,313) | | | (1,332) | | | (1,109) | |
| Undistributed earnings for the period | $ | 168,248 | | | $ | 170,609 | | | $ | 156,981 | |
| Allocation of undistributed earnings: | | | | | |
| Common stock | $ | 167,507 | | | $ | 169,687 | | | $ | 156,123 | |
| Time-lapse restricted awards | 741 | | | 859 | | | 823 | |
| Restricted stock units | — | | | 63 | | | 35 | |
| Weighted-average shares outstanding: | | | | | |
| Weighted-average outstanding common shares | 482,117 | | 487,480 | | 489,719 |
| Add participating securities: | | | | | |
| Weighted-average time-lapse restricted awards | 2,132 | | 2,469 | | 2,581 |
| Total weighted-average shares outstanding – basic | 484,249 | | 489,949 | | 492,300 |
| Dilutive effect of restricted stock units | 46 | | 181 | | 113 |
| Total weighted-average shares outstanding – diluted | 484,295 | | 490,130 | | 492,413 |
| | | | | |
| Basic earnings per share: | | | | | |
| Common stock: | | | | | |
| Distributed earnings | $ | 0.62 | | | $ | 0.54 | | | $ | 0.43 | |
| Undistributed earnings | 0.34 | | | 0.35 | | | 0.32 | |
| $ | 0.96 | | | $ | 0.89 | | | $ | 0.75 | |
| | | | | |
| | | | | |
| | | | | |
| | | | | |
| Diluted earnings per share: | | | | | |
| Common stock: | | | | | |
| Distributed earnings | $ | 0.62 | | | $ | 0.54 | | | $ | 0.43 | |
| Undistributed earnings | 0.34 | | | 0.35 | | | 0.32 | |
| $ | 0.96 | | | $ | 0.89 | | | $ | 0.75 | |
| | | | | |
| | | | | |
| | | | | |
| | | | | |
| | | | | |
| | | | | |
| | | | | |
| | | | | |
19. SEGMENT AND GEOGRAPHIC INFORMATION
The Company operates under one reportable segment which contains our residential, commercial, and termite service offerings. The Company's chief operating decision maker ("CODM") is the chief executive officer. The CODM uses net income to assess financial performance and allocate resources. This financial metric is used by the CODM to make key operating decisions, such as the determination of the rate of growth investments and the allocation of budget between cost categories. The measure of segment assets is reported on the balance sheet as total consolidated assets.
The following table presents selected financial information with respect to the Company’s single reportable segment for the years ended December 31:
| | | | | | | | | | | | | | | | | |
| (in thousands) | 2024 | | 2023 | | 2022 |
| Revenue | $ | 3,388,708 | | | $ | 3,073,278 | | | $ | 2,695,823 | |
| | | | | |
| Less: | | | | | |
| Cost of services provided (exclusive of depreciation and amortization below): | | | | | |
| Employee expenses | 1,048,992 | | | 953,600 | | | 850,615 | |
| Materials and supplies | 212,296 | | | 197,825 | | | 175,402 | |
| Insurance and claims | 68,326 | | | 60,390 | | | 50,726 | |
| Fleet expenses | 131,898 | | | 127,390 | | | 117,035 | |
Other cost of services provided (1) | 141,685 | | | 130,666 | | | 114,621 | |
| Total cost of services provided (exclusive of depreciation and amortization below) | 1,603,197 | | | 1,469,871 | | | 1,308,399 | |
| | | | | |
| Sales, general and administrative: | | | | | |
| Selling and marketing expenses | 427,916 | | | 375,805 | | | 324,935 | |
| Administrative employee expenses | 313,814 | | | 291,772 | | | 263,547 | |
| Insurance and claims | 41,434 | | | 37,946 | | | 30,464 | |
| Fleet expenses | 33,580 | | | 31,415 | | | 29,686 | |
Other sales, general and administrative (2) | 198,323 | | | 178,295 | | | 154,078 | |
| Total sales, general and administrative | 1,015,067 | | | 915,233 | | | 802,710 | |
| | | | | |
| Restructuring costs | — | | | 5,196 | | | — | |
| Depreciation and amortization | 113,220 | | | 99,752 | | | 91,326 | |
| Interest expense, net | 27,677 | | | 19,055 | | | 2,638 | |
| Other income, net | (683) | | | (22,086) | | | (8,167) | |
| Income tax expense | 163,851 | | | 151,300 | | | 130,318 | |
| Net income | $ | 466,379 | | | $ | 434,957 | | | $ | 368,599 | |
1) Other cost of services provided includes facilities costs, professional services, maintenance and repairs, software license costs, and other expenses directly related to providing services.
2) Other sales, general and administrative includes facilities costs, professional services, maintenance and repairs, software license costs, bad debt expense, and other administrative expenses.
See the consolidated financial statements for other financial information regarding the Company’s reportable segment. See Note 3, Revenue for further information on revenue.
The Company's long-lived tangible assets, as well as the Company's operating lease right-of-use assets recognized on the consolidated statements of financial position were located as follows:
| | | | | | | | | | | |
| December 31, | 2024 | | 2023 |
| (in thousands) | | | |
| United States | $ | 503,767 | | | $ | 422,340 | |
| International | 35,546 | | | 27,711 | |
20. SUBSEQUENT EVENTS
Quarterly Dividend
On January 22, 2025, the Company’s Board of Directors declared a regular quarterly cash dividend on its common stock of $0.165 payable March 10, 2025 to stockholders of record at the close of business February 25, 2025. The Company expects to continue to pay cash dividends to the common stockholders, subject to the earnings and financial condition of the Company and other relevant factors.
Item 9. Changes in and Disagreements with Accountants on Accounting and Financial Disclosures.
None.
Item 9A. Controls and Procedures
Evaluation of Disclosure Controls and Procedures
The Company has a Disclosure Committee, consisting of certain members of management to assist our Chief Executive Officer (principal executive officer) and Chief Financial Officer (principal financial officer) in preparing the disclosures required under the SEC rules and to help confirm that the Company’s disclosure controls and procedures are properly implemented. The Disclosure Committee meets on a quarterly basis and otherwise as may be necessary.
Our management, with the participation of our principal executive officer and principal financial officer, conducted an evaluation of the effectiveness of the design and operation of our disclosure controls and procedures, as defined in rules 13a 15(e) and 15d-15(e) under the Securities Exchange Act of 1934, as amended (the “Exchange Act”) as of December 31, 2024 (the “Evaluation Date”). Based on this evaluation, our principal executive officer and principal financial officer concluded that our disclosure controls and procedures were effective at the reasonable assurance level as of the Evaluation Date to confirm that the information required to be included in reports filed under the Exchange Act is recorded, processed, summarized and reported within the time periods specified in SEC rules and forms.
Management’s Report on Internal Control Over Financial Reporting—Management’s Report on Internal Control Over Financial Reporting is contained on page 37. The effectiveness of our internal control over financial reporting as of December 31, 2024 has been audited by Deloitte & Touche LLP, an independent registered public accounting firm, as stated in its report on page 38. Changes in Internal Controls—There were no changes in the Company’s internal control over financial reporting, as defined in Rule 13a-15(f) under the Exchange Act, during the quarter ended December 31, 2024 that have materially affected, or are reasonably likely to materially affect, the Company’s internal control over financial reporting.
Item 9B. Other Information
On February 11, 2025, the Company’s Human Capital Management and Compensation Committee approved the following: (1) Change-in-Control and Restrictive Covenant Agreements with certain of its executive officers, including Jerry E. Gahlhoff, Jr., Kenneth D. Krause, and Elizabeth B. Chandler; (2) Indemnification Agreements with each of its executive officers and directors; and (3) an Amended and Restated Deferred Compensation Plan. The following description of these agreements and plan is a summary only and is qualified by reference to the form of agreements and plan themselves, which are filed as Exhibits 10.15, 10.6, and 10.7 hereto, respectively.
1.Each Change-in-Control and Restrictive Covenant Agreement provides that:
•In the event of a termination of the executive officer’s employment by the Company without “cause” or by the executive for “good reason”, in either case within twenty-four (24) months following a “change in control,” as such terms are defined in the agreement, the executive officer will be eligible to receive the following benefits, subject to his or her execution and non-revocation of a release of claims and compliance with the restrictive covenants outlined below:
◦a lump sum cash severance payment equal to a multiple of the executive officer’s base salary and target cash bonus (3x for the Chief Executive Officer; 2x for the Chief Financial Officer; and 1.5x for the Chief Legal Officer),
◦a pro-rated bonus payment for the year of termination,
◦payment of employer-portion of health plan premium for 18 months, and
◦vesting of performance share units based on assumed achievement of target level of performance.
•The executive officer will be subject to certain restrictive covenants following his or her termination of employment for any reason, including:
◦restrictions on the disclosure and use of confidential information,
◦2-year post-employment non-competition covenant,
◦2-year post-employment non-solicitation of protected customers covenant,
◦2-year post-employment non-recruitment of employees and independent contractors covenant, and
◦a non-disparagement obligation.
2.Each Indemnification Agreement provides that:
•In general, the Company will, to the extent permitted by applicable law and subject to certain limitations, indemnify the executive officer or director against all costs, expenses, liabilities and losses actually and reasonably incurred or suffered in connection with any threatened, pending or completed action, suit, arbitration or proceeding or any inquiry or investigation the defense or settlement of any civil, criminal, administrative, or investigative action, suit, or proceeding to which he or she is or may become a party or a witness or other participant based upon, arising from, relating to, or by reason of the fact that he or she is, was, shall be, or shall have been a director and/or officer of the Company or is or was serving, shall serve, or shall have served at the request of the Company as a director, officer, partner, trustee, employee, or agent.
•The Indemnification Agreement does not exclude any other rights to indemnification or advancement of expenses to which the executive officer or director may be entitled, including any rights arising under the Company’s articles, by-laws, law, agreement, policy of insurance or similar protection, vote of stockholders or directors.
3.Amended and Restated Deferred Compensation Plan
•The Plan provides Participants, which include all of our executive officers, with the right to elect to defer Annual Regular Compensation up to 50% and/or Annual Bonus Payments up to 85%.
•For each payment of Annual Regular Compensation or Annual Bonus Payment from which a Participant elects to have amounts deferred under the Plan, the Plan Committee shall credit to the Participant’s Company Match Account an amount equal to fifty percent (50%) of the amount of such deferrals subject to a maximum annual match credit of three percent (3%) of such payment of Annual Regular Compensation or Annual Bonus Payment, respectively.
Rule 10b5-1 Trading Plans
Securities Trading Plans of Directors and Executive Officers
During the three months ended December 31, 2024, the following directors and “officers” (as defined in Rule 16a-1(f) under the Securities Exchange Act of 1934, as amended) adopted, modified or terminated contracts, instructions or written plans for the sale of the Company’s securities, each of which is intended to satisfy the affirmative defense conditions of Rule 10b5-1(c) of the Exchange Act, referred to as Rule 10b5-1 trading plans.
| | | | | | | | | | | | | | | | | |
Name and Title | Date of Adoption of the Rule 10b5-1 Trading Plan | Scheduled Expiration Date of the Rule 10b5-1 Trading Plan | Total Amount of Securities to Be Sold | Transactions Pursuant to 10b5-1 Trading Plan | Early Termination of the Rule 10b5-1 Trading Plan |
Elizabeth B. Chandler Chief Legal Officer, General Counsel and Corporate Secretary | October 25, 2024 | April 25, 2025 | Net shares of Company common stock obtained upon vesting of 20,377 shares subject to currently unvested restricted stock grants | Sales to occur on or after February 21, 2025, if certain limit prices are met and if restricted stock has vested | If all net shares of Company common stock obtained upon vesting of 20,377 shares subject to currently unvested restricted stock grants are sold prior to the scheduled expiration date, the trading plan will terminate on such earlier date |
Thomas D. Tesh Chief Administrative Officer | December 9, 2024 | May 30, 2025 | 5,763 shares of Company common stock | Sales to occur on or after March 10, 2025, if certain limit prices are met and if restricted stock has vested | If all 5,763 shares are sold prior to the scheduled expiration date, the trading plan will terminate on such earlier date |
Item 9C. Disclosure Regarding Foreign Jurisdictions that Prevent Inspections.
Not Applicable.
PART III
Item 10. Directors, Executive Officers and Corporate Governance.
The information required by this Item, except that set forth below regarding the Company’s code of ethics and insider trading policy, will be set forth in our Proxy Statement for the 2025 Annual Meeting of Stockholders and is incorporated herein by reference. The Proxy Statement will be filed with the SEC within 120 days of the fiscal year ended December 31, 2024, or by the following business day.
The Company has adopted a Code of Business Conduct that applies to all employees. In addition, the Company has adopted a Code of Business Conduct and Ethics for Directors and Executive Officers and Related Party Transactions. Both of these documents are available on the Company’s website at www.rollins.com, under the heading “Governance- Governance Documents,” and a copy is available by writing to Investor Relations at 2170 Piedmont Road, Atlanta, Georgia 30324. The Company intends to satisfy the disclosure requirement under Item 5.05 of Form 8-K regarding an amendment to, or waiver from, a provision of its code of ethics that relates to any elements of the code of ethics definition enumerated in SEC rules by posting such information on its internet website, the address of which is provided above.
The Company has adopted an insider trading policy which governs transactions in our securities by the Company and its directors, officers, employees, consultants, and contractors and is reasonably designed to promote compliance with insider trading laws, rules and regulations applicable to the Company. A copy of our insider trading policy is filed with this Annual Report on Form 10-K as Exhibit 19.1.
Item 11. Executive Compensation.
The information required by this Item will be set forth in our Proxy Statement for the 2025 Annual Meeting of Stockholders and is incorporated herein by reference. The Proxy Statement will be filed with the SEC within 120 days of the fiscal year ended December 31, 2024, or by the following business day.
Item 12. Security Ownership of Certain Beneficial Owners and Management and Related Stockholder Matters.
The information required by this Item will be set forth in our Proxy Statement for the 2025 Annual Meeting of Stockholders and is incorporated herein by reference. The Proxy Statement will be filed with the SEC within 120 days of the fiscal year ended December 31, 2024, or by the following business day.
Item 13. Certain Relationships and Related Party Transactions, and Director Independence.
Information concerning certain relationships and related party transactions and director independence will be included in the Proxy Statement for the 2025 Annual Meeting of Stockholders and is incorporated herein by reference. The Proxy Statement will be filed with the SEC within 120 days of the fiscal year ended December 31, 2024, or by the following business day.
Item 14. Principal Accounting Fees and Services.
Information regarding principal accounting fees and services will be included in the Proxy Statement for the 2025 Annual Meeting of Stockholders and is incorporated herein by reference. The Proxy Statement will be filed with the SEC within 120 days of the fiscal year ended December 31, 2024, or by the following business day.
PART IV
Item 15. Exhibits and Financial Statement Schedules
(a)Consolidated Financial Statements, Financial Statement Schedule and Exhibits.
1.Consolidated financial statements listed in the accompanying Index to Consolidated Financial Statements and Schedule are filed as part of this report.
2.All schedules have been omitted as not applicable, immaterial or disclosed in the Consolidated Financial Statements or notes thereto.
3.Exhibits listed in the accompanying Index to Exhibits are filed as part of this report.
| | | | | | | | | | | | | | | | | |
| Exhibit No. | Exhibit Description | Incorporated By Reference | Filed Herewith |
| | Form | Date | Number | |
| 3.1 | | 10-Q | August 1, 2005 | (3)(i)(A) | |
| 3.2 | | 10-K | March 11, 2005 | (3)(i)(B) | |
| 3.3 | | 10-Q | August 1, 2005 | (3)(i)(C) | |
| 3.4 | | 10-K | February 25, 2015 | (3)(i)(E) | |
| 3.5 | | 10-Q | July 29, 2015 | (3)(i)(F) | |
| 3.6 | | 10-Q | April 26, 2019 | (3)(i)(G) | |
| 3.7 | | 10-Q | July 30, 2021 | (3)(i)(H) | |
| 3.8 | | 10-Q | July 25, 2024 | 3.8 | |
| 4.1 | | 10-K | March 26, 1999 | (4) | |
| 4.2 | | 10-K | February 28, 2020 | 4(b) | |
| 10.1* | | DEF 14A | March 21, 2018 | Appendix A | |
| 10.2* | | 10-Q | October 27, 2022 | 10.19 | |
| 10.3* | | 8-K | February 27, 2023 | 10.1 | |
| 10.4* | | S-3 | June 5, 2023 | 4.11 | |
| 10.5* | | | | | X |
| 10.6* | | | | | X |
| 10.7* | | | | | X |
| 10.8* | | 10-Q | April 27, 2012 | 10.1 | |
| 10.9* | | 10-Q | October 27, 2022 | 10.18 | |
| 10.10* | | 10-K | February 15, 2024 | 10.1 | |
| 10.11* | | 10-K | February 15, 2024 | 10.23 | |
| 10.12* | | 10-K | February 15, 2024 | 10.24 | |
| 10.13* | | | | | X |
| | | | | | | | | | | | | | | | | |
| 10.14* | | | | | X |
| 10.15* | | 10-K | February 15, 2024 | 10.11 | |
| 10.16* | | 10-K | February 15, 2024 | 10.14 | |
| 10.17* | | 10-K | February 15, 2024 | 10.12 | |
| 10.18* | | 10-K | February 15, 2024 | 10.13 | |
| 10.19* | | 10-K | February 15, 2024 | 10.15 | |
| 10.20* | | | | | X |
| 10.21* | | | | | X |
| 10.22* | | | | | X |
| 10.23* | | | | | X |
| 10.24* | | | | | X |
| 19.1 | | | | | X |
| 21 | | | | | X |
| 23.1 | | | | | X |
| 23.2 | | | | | X |
| 24 | | | | | X |
| 31.1 | | | | | X |
| 31.2 | | | | | X |
| 32.1** | | | | | X |
| 97.1 | | 10-K | February 15, 2024 | 97.10 | |
| 101.INS | Inline XBRL Instance Document | | | | X |
| 101.SCH | Inline XBRL Schema Document | | | | X |
| 101.CAL | Inline XBRL Calculation Linkbase Document | | | | X |
| 101.LAB | Inline XBRL Labels Linkbase Document | | | | X |
| 101.PRE | Inline XBRL Presentation Linkbase Document | | | | X |
| 101.DEF | Inline XBRL Definition Linkbase Document | | | | X |
| 104 | Cover Page Interactive Data File (embedded with the Inline XBRL document) | | | | X |
* Indicates management contract or compensatory plan or arrangement.
** This certification is deemed furnished, and not filed, with the Securities and Exchange Commission and is not to be incorporated by reference into any filing of Rollins, Inc. under the Securities Act of 1933, as amended, or the Securities Exchange Act of 1934, as amended, whether made before or after the date of this Annual Report on Form 10-K, irrespective of any general incorporation language contained in such filing.
Item 16. Form 10-K Summary
None.
SIGNATURES
Pursuant to the requirements of Section 13 or 15(d) of the Securities Exchange Act of 1934, the Registrant has duly caused this report to be signed on its behalf by the undersigned, thereunto duly authorized.
| | | | | | | | |
| ROLLINS, INC. |
| | |
| By: | /s/ Jerry E. Gahlhoff, Jr. |
| | Jerry E. Gahlhoff, Jr. |
| | President and Chief Executive Officer |
| | (Principal Executive Officer) |
| | |
| Date: | February 13, 2025 |
Pursuant to the requirements of the Securities Exchange Act of 1934, this report has been signed below by the following persons on behalf of the Registrant and in the capacities and on the dates indicated.
| | | | | | | | | | | | | | |
| By: | /s/ Jerry E. Gahlhoff, Jr. | | By: | /s/ Kenneth D. Krause |
| Jerry E. Gahlhoff, Jr. | | | Kenneth D. Krause |
| President and Chief Executive Officer | | | Executive Vice President and Chief Financial Officer |
| (Principal Executive Officer) | | | (Principal Financial Officer) |
| | | | |
| Date: | February 13, 2025 | | Date: | February 13, 2025 |
| | | | |
| By: | /s/ Traci Hornfeck | | | |
| Traci Hornfeck | | | |
| Chief Accounting Officer | | | |
| (Principal Accounting Officer) | | | |
| | | | |
| Date: | February 13, 2025 | | | |
The Directors of Rollins, Inc. (listed below) executed a power of attorney appointing Jerry E. Gahlhoff, Jr. their attorney-in-fact, empowering him to sign this report on their behalf.
| | | | | | | | |
| Gary W. Rollins, Executive Chairman Emeritus | |
| John F. Wilson, Executive Chairman of the Board | |
| Louise S. Sams, Lead Director | |
| Susan R. Bell, Director | |
| Donald P. Carson, Director | |
| Jerry E. Gahlhoff, Director | |
| Patrick J. Gunning, Director | |
| Gregory B. Morrison, Director | |
| Pamela R. Rollins, Director | |
| P. Russell Hardin, Director | |
| /s/ Jerry E. Gahlhoff, Jr. | | |
| Jerry E. Gahlhoff, Jr. | |
| As Attorney-in-Fact & Director | |
| February 13, 2025 | |
ROLLINS, INC. AND SUBSIDIARIES
INDEX TO CONSOLIDATED FINANCIAL STATEMENTS AND SCHEDULE
The following documents are filed as part of this report.
| | | | | | | | |
| Financial statements and reports | | Page
Number
From
This Form
10-K |
| | |
| | |
| | |
| Consolidated Financial Statements | | |
| | |
| | |
| | |
| | |
| | |
| | |
| | |
| Financial Statement Schedules | | |
| All schedules have been omitted as not applicable, immaterial or disclosed in the Consolidated Financial Statements or notes thereto. | | |